. 2025 May 30;23(1):398.
doi: 10.1186/s12951-025-03487-8.

TRPC6-targeted dexamethasone nanobubbles with ultrasound-guided theranostics for adriamycin-induced nephropathy

Affiliations

TRPC6-targeted dexamethasone nanobubbles with ultrasound-guided theranostics for adriamycin-induced nephropathy

Lin Wu et al. J Nanobiotechnology. .

Abstract

Background: Glucocorticoid (GC) intolerance and systemic toxicity pose significant challenges in the treatment of primary nephrotic syndrome (PNS), underscoring the urgent need for targeted therapies that maximize efficacy while minimizing adverse effects. To address these challenges, we developed TRPC6-targeted dexamethasone-loaded nanobubbles (Dex@NBs-TRPC6)-an innovative therapeutic platform that enables selective podocyte delivery alongside real-time monitoring capabilities.

Results: The Dex@NBs-TRPC6 nanobubble system comprises polyethylene glycol-modified lipid vesicles encapsulating dexamethasone (Dex), conjugated with TRPC6-specific antibody for precise podocyte targeting delivery. Comprehensive in vivo and in vitro evaluations demonstrated the robust kidney and podocyte-targeting capabilities of Dex@NBs-TRPC6. Functional assays in mouse podocyte cells revealed that Dex@NBs-TRPC6 significantly outperformed free Dex and non-targeted nanobubbles (Dex@NBs) in mitigating cell apoptosis and inflammation. In an adriamycin-induced mouse nephropathy model, Dex@NBs-TRPC6, administered at half the dosage of free Dex, markedly alleviated proteinuria, glomerular and tubular damage, renal apoptosis, inflammation and fibrosis. Notably, Dex@NBs-TRPC6 attenuated the overexpression of hepatic gluconeogenic genes PCK1 and GCP6, a common adverse effect associated with Dex. Furthermore, leveraging the acoustic response properties of Dex@NBs-TRPC6, this delivery system integrates ultrasound imaging capabilities, enabling real-time visualization and therapeutic monitoring.

Conclusions: By simultaneously enhancing therapeutic efficacy, minimizing systemic toxicity, and enabling personalized imaging-guided treatment, Dex@NBs-TRPC6 introduces a transformative approach to GC-based renal therapy.


Conflict of interest statement

Declarations. Ethics approval and consent to participate: All animal experiments were in accordance with the National Institutes of Health guide for the care and use of Laboratory animals. All animal experiments were approved by Institutional Animal Care and Use Committee of Nanjing Medical University (2206008). Consent for publication: All authors have provided consent for the manuscript to be published. Competing interests: The authors declare no competing interests.

Figures

Scheme 1
Scheme 1
Schematic illustration of the preparation of ultrasound-responsive Dex@NBs-TRPC6 nanobubbles and their targeted therapeutic mechanism in adriamycin (ADR)-induced nephropathy. A lipid-based nanobubble system using synthetic phospholipid molecules as the membrane shell of the nanobubbles, podocyte specific protein TRPC6 as the targeting molecule, and dexamethasone as the therapeutic drug was constructed. The nanobubbles could specifically reach the podocytes of the renal glomeruli through size penetration passive targeting and TRPC6-mediated active targeting. Ultrasound stimulation assisted nanobubble imaging and drug release, ultimately realizing targeted therapy for ADR-induced nephropathy
Fig. 1
Fig. 1
Preparation and characterization of Dex@NBs-TRPC6. (A) Schematic illustration of the structure of Dex@NBs-TRPC6 and its conjugation with Dex and TRPC6 antibody. (B) Histogram of size distribution of NBs, Dex@NBs and Dex@NBs-TRPC6 obtained by DLS measurements, respectively. (C) Transmission electron microscopy (TEM) morphology characterization of Dex@NBs-TRPC6. Scale bar = 200 nm. (D) Distribution mapping of the element composition of Dex@NBs-TRPC6. (E) FT-IR scanning of lyophilized powder of free Dex, TRPC6, and Dex@NBs-TRPC6. (F) The size distribution and (G) Zeta potential of Dex@NBs-TRPC6 within 21 days in PBS and FBS. (H) In vitro ultrasound imaging performance and (I) quantitative analysis of Dex@NBs-TRPC6 at different concentrations (0, 0.5×10⁹, 1.0×10⁹, 1.5×10⁹, 2.0×10⁹, and 5.0×10⁹ bubbles/mL). (J) In vitro B-mode and contrast-mode ultrasound images performance of Dex@NBs-TRPC6 at different time intervals (0, 5, 10, 15, 20, and 30 min). (K) Quantitative analysis of the mean power in contrast mode and (L) B-mode of different bubble samples (NBs, Dex@NBs and Dex@NBs-TRPC6). (M) In vitro release profiles of Dex from Dex@NBs-TRPC6 under different power ultrasound stimulation (0, 30, 60, 250, and 500 mW/cm2). (N) Quantitative analysis of the bubble breakage rates under different ultrasound conditions
Fig. 2
Fig. 2
Cell targeting efficiency of Dex@NBs-TRPC6 in vitro. (A) Left: WB analysis of TRPC6, podocin and cleaved caspase 3 activation with different incubation time (0, 12, 24, and 36 h) in a dose of 1 µg/mL ADR treatment. Right: Densitometry analysis. n = 3. (B) Left: WB analysis of TRPC6, podocin and cleaved caspase 3 activation with different doses (0, 0.5, 1.0, and 1.5 µg/mL) of ADR treatment for 24 h. Right: Densitometry analysis. n = 3. (C) In vitro targeting efficiency of Dex@NBs-TRPC6 were observed with fluorescence microscopy after different co-incubation times (0, 8, 12, 24, and 48 h). Nuclei were stained by DAPI. Dex@NBs (as a comparison) and Dex@NBs-TRPC6 were pre-labeled by DiO (green), scale bar = 50 μm. (D) Left: Flow cytometry determined the cell targeting efficiency of Dex@NBs and Dex@NBs-TRPC6 at the same time point as described in figure (C). Right: Quantitative analysis of the flow cytometry results. Data are presented as mean ± SEM, one-way ANOVA, **p < 0.01, Dex@NBs-TRPC6 vs. Dex@NBs group
Fig. 3
Fig. 3
Evaluation of safety and therapeutic effect of Dex@NBs-TRPC6 in vitro. (A) Cell viability of MPC cells treated with free Dex, Dex@NBs and Dex@NBs-TRPC6 in dose of 10− 5 and 10− 7 mol/L of Dex. n = 6. (B) Representative images of cell apoptosis determined by flow cytometry in MPC cells treated with free Dex, Dex@NBs and Dex@NBs-TRPC6 in a dose of 10− 5 mol/L of Dex. (C) Statistical analysis of flow cytometry, n = 3. (D) Left: Representative WB images of podocin and cleaved caspase 3 for MPC cells after treated by a dose of 1 µM ADR for 24 h. Normal cells without any treatment was dedicated as control group. Usage dose of Dex was 10− 7 mol/L in free style or in nanobubbles formulation. NS: 0.9% NaCl solution as a vehicle. Right: Densitometry analysis, n = 3. (E) RT-PCR analysis of mRNA expression of TNFα, IL-1β, IL-6 (n = 3). Data are presented as mean ± SEM, one-way ANOVA. *p < 0.05, **p < 0.01, vs. Control group #p < 0.05, ##p < 0.01, vs. ADR + NS group, $p < 0.05, $$p < 0.01 as indicated
Fig. 4
Fig. 4
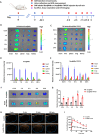
In vivo biodistribution of Dex@NBs-TRPC6 in ADR-induced model mice. (A) Schematic representation of fluorescence imaging protocol. The typical fluorescence imaging of Dex@NBs (B) and Dex@NBs-TRPC6 (C) in heart, liver, spleen, lung, and kidney in ADR-induced model mice at different periods of time (0.5, 1, 4, 8, and 24). n = 3. Quantitative analysis of the relative fluorescence intensity of Dex@NBs (D) and Dex@NBs-TRPC6 (E) corresponding to the image (B) and (C), respectively. (F) Comparison of the fluorescence intensities of Dex@NBs and Dex@NBs-TRPC6 in ADR mouse kidney at different time points (0.5, 1, 4, 8, and 24 h). (G) Quantitative analysis of accumulation of Dex@NBs and Dex@NBs-TRPC6 in kidney at different time points, n = 3. (H) Representative kidney ultrasound enhancement images of Dex@NBs and Dex@NBs-TRPC6 in kidney of ADR-induced model mice at different time points (0, 5, 15, and 120 min). Circles in blue line presented kidney area. (I) Quantitative analysis of ultrasound signal intensity of Dex@NBs and Dex@NBs-TRPC6 at different time points after injection. n = 3. Data are presented as mean ± SEM, one-way ANOVA, **p < 0.01, vs. Dex@NBs group. ##p < 0.01, vs.0.5, 1, 4, and 24 h in Dex@NBs group. $$p < 0.01, vs.0.5, 1, 4, and 24 h in Dex@NBs-TRPC6 group
Fig. 5
Fig. 5
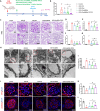
In vivo therapeutic effects of Dex@NBs-TRPC6. (A) Schematic diagram of in vivo treatment and therapy protocol. Normal mouse without any treatment was dedicated as control group. (B) Albuminuria (urine albumin-to-creatinine ratio) was determined in control group, ADR + NS group and three Dex-treated ADR groups. n = 9–10 mice per group. (C) Representative kidney images of PAS staining. Upper: glomerular morphology, scale bar = 20 μm; Lower: tubule-interstitial morphology, scale bar = 50 μm. (D) Quantitative analysis of glomerulosclerosis severity. (E) Quantitative analysis of tubular injury. (F) RT-PCR analysis of mRNA expression of Kim-1. (G) RT-PCR analysis of mRNA expression of NGAL. n = 9. (H) Representative images of TEM of glomerular basement membrane. Top: scale bar = 2 μm, Bottom: scale bar = 500 nm. (I) Quantitative analysis of foot process width. n = 6 mice per group in all histological analysis. (J) Upper: immunofluorescence staining of WT1 expressed in nuclei of mouse podocytes, scale bar = 20 μm. Lower: immunofluorescence staining of podocin expressed along the glomerular basement membrane, scale bar = 20 μm. (K) Quantitative analysis of WT1 positive cell numbers per glomerulus, n = 6. (L) Quantitative analysis of fluorescence intensity of podocin, n = 6. Data are presented as mean ± SEM, one-way ANOVA. *p < 0.05, **p < 0.01, vs. Control group, #p < 0.05, ##p < 0.01, vs. ADR + NS group, $p < 0.05, $$p < 0.01 as indicated
Fig. 6
Fig. 6
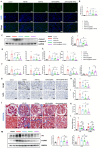
Dex@NBs-TRPC6 reduced apoptosis, inflammation, and fibrosis in ADR mice. (A) Apoptosis cells in kidney tissue were measured by TUNEL staining, Scale bar = 50 μm. (B) Quantitative assessment of TUNEL positive cells, n = 6. (C) Left: Representative WB of cleaved caspase 3 in kidney tissue. Right: Densitometry analysis of cleaved caspase 3, n = 8. (D) IL-1β and IL-6 levels in mouse serum were measured by ELISA, n = 6. (E) IL-1β and IL-6 levels in renal tissue were measured by ELISA, n = 9. (F) RT-PCR measurement of mRNA levels of inflammatory cytokines in kidney tissue including IL-1β, IL-6, TNFα, MCP1 and IL-10, n = 9. (G) Immunohistochemical staining of macrophages (upper) and neutrophils (lower) in mouse kidney tissue, scale bar = 50 μm. (H) Quantitative analysis of macrophages, n = 6. (I) Quantitative analysis of neutrophils, n = 6. (J) Representative images of Masson staining. Upper: glomerular morphology, scale bar = 20 μm; Lower: tubule-interstitial morphology, scale bar = 50 μm. (K) Quantitative analysis of tubule-interstitial fibrosis, n = 6. (L) RT-PCR measurement of mRNA level of FN and α-SMA in mouse kidney tissues, n = 9. (M) Left: Protein expression levels of FN and α-SMA in mouse kidney were determined by Western Blot. Right: Densitometric analysis of proteins levels of FN and α-SMA, n = 8. Data are presented as mean ± SEM, one-way ANOVA, **p < 0.01, vs. Control group. ##p < 0.01, #p < 0.05, vs. ADR + NS group. $$p < 0.01, $p < 0.05 as indicated
Fig. 7
Fig. 7
Side-effect evaluation of Dex@NBs-TRPC6 in ADR mice. (A) Body weights were measured every 2 days during therapeutic period. (B) Levels of blood glucose were measured using blood glucose test strips. (C) Serum levels of SCr, BUN, ALT, AST, UA, ALB, TG and CHO were measured by an automatic biochemical analyzer. (D) RT-PCR analysis of gluconeogenic genes PCK1 and G6PC, and glycolytic gene HK2 in livers. n = 9–10 in A-D assays. Data are presented as mean ± SEM, one-way ANOVA, **p < 0.01, *p < 0.05, vs. Control group. ##p < 0.01, #p < 0.05, vs. ADR + NS group. $$p < 0.01, $p < 0.05 as indicated

Similar articles

References

    1. Go AS, Tan TC, Chertow GM, Ordonez JD, Fan D, Law D, et al. Primary nephrotic syndrome and risks of ESKD, ardiovascular events, and death: the Kaiser permanente nephrotic syndrome study. J Am Soc Nephrol. 2021;32(9):2303–14. - PMC - PubMed
    1. Rovin BH, Adler SG, Barratt J, Bridoux F, Burdge KA, Chan TM, et al. Executive summary of the KDIGO 2021 guideline for the management of glomerular diseases. Kidney Int. 2021;100(4):753–79. - PubMed
    1. Ponticelli C, Locatelli F. Glucocorticoids in the treatment of glomerular diseases: pitfalls and pearls. Clin J Am Soc Nephrol. 2018;13:815–22. - PMC - PubMed
    1. Kumar S, Allen DA, Kieswich JE, Patel NS, Harwood S, Mazzon E, et al. Dexamethasone ameliorates renal Ischemia-Reperfusion injury. J Am Soc Nephrol. 2009;20(11):2412–25. - PMC - PubMed
    1. Koch A, Jäger M, Völzke A, Grammatikos G, Zu Heringdorf DM, Huwiler A, et al. Downregulation of sphingosine 1-phosphate (S1P) receptor 1 by dexamethasone inhibits S1P-induced mesangial cell migration. Biol Chem. 2015;396(6–7):803–12. - PubMed

MeSH terms