. 2025 May 30;23(1):599.
doi: 10.1186/s12967-025-06559-3.

Multiplex imaging reveals novel patterns of MRTFA/B activation in the breast cancer microenvironment

Affiliations

Multiplex imaging reveals novel patterns of MRTFA/B activation in the breast cancer microenvironment

Stephanie M Wilk et al. J Transl Med. .

Abstract

Background: Breast cancer progression and metastasis involve the action of multiple transcription factors in tumors and in the cells of the tumor microenvironment (TME) and understanding how these transcription factors are coordinated can guide novel therapeutic strategies. Myocardin-related transcription factors A and B (MRTFA/B also known as MKL1/2) are two related transcription factors that redundantly control cancer cell invasion and metastasis in mouse models of breast cancer, but their roles in human cancer are incompletely understood. Here, we investigated the expression and activation of these transcription factors to better assess their tumorigenic and metastatic impact on breast cancer and cells of the tumor microenvironment.

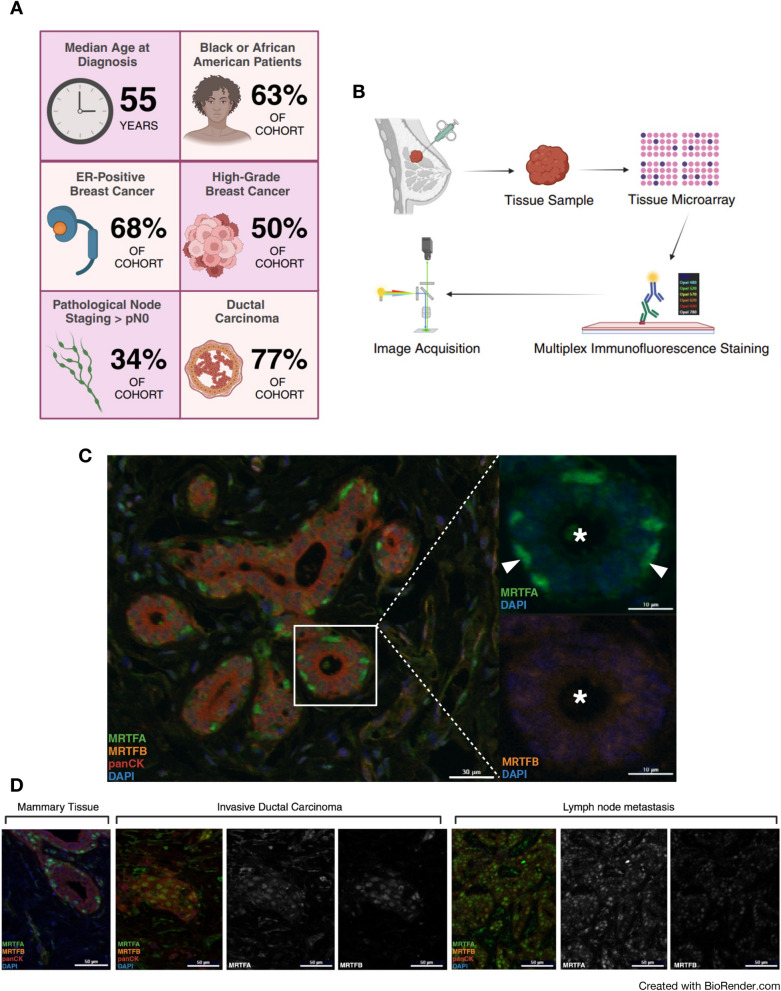
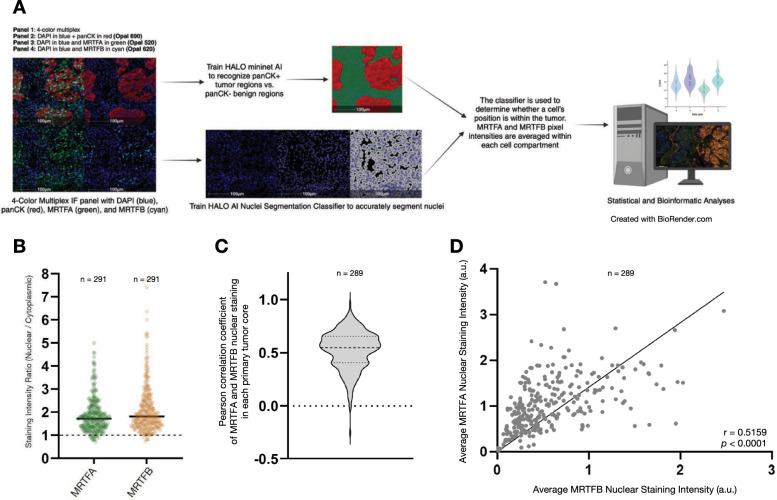
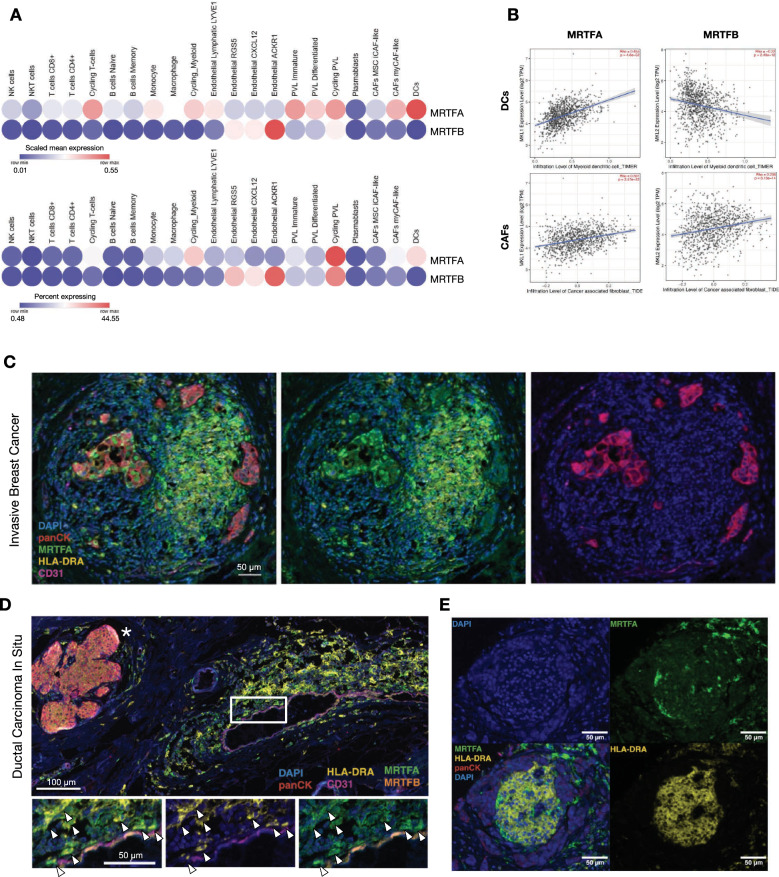
Methods: We used a multiplexed immunofluorescence approach to label MRTFA, MRTFB, tumor cells by using pan Cytokeratin, endothelial cells by using CD31, and antigen presenting cells (APCs) by using HLA-DRA on two different breast cancer tissue microarrays (TMA): The breast cancer progression TMA provided by the Cooperative Human Tissue Network (CHTN_BrCaProg3) and the University of Illinois Breast Cancer Working Group (TMA BCWG UIC-001-TMA) that included primary tumor and lymph node metastases from patients residing in the West Side and South Side of Chicago. We also used bioinformatics analyses of the TCGA and METABRIC databases and the Broad Institute's single-cell RNA sequencing portal to investigate MRTFA/B expression patterns in the cells of the tumor microenvironment (TME).

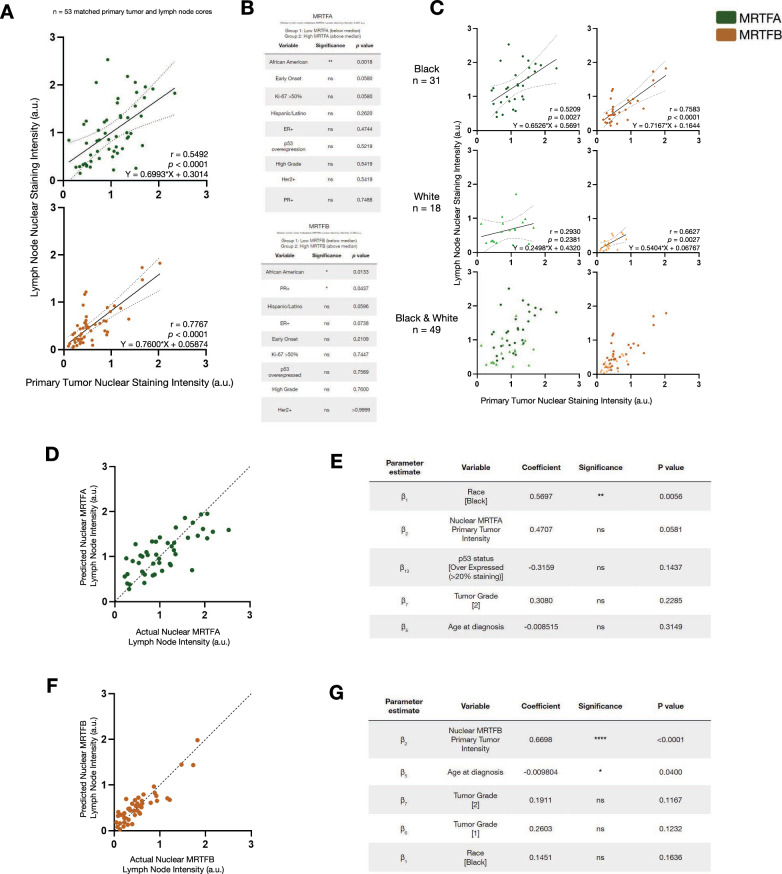
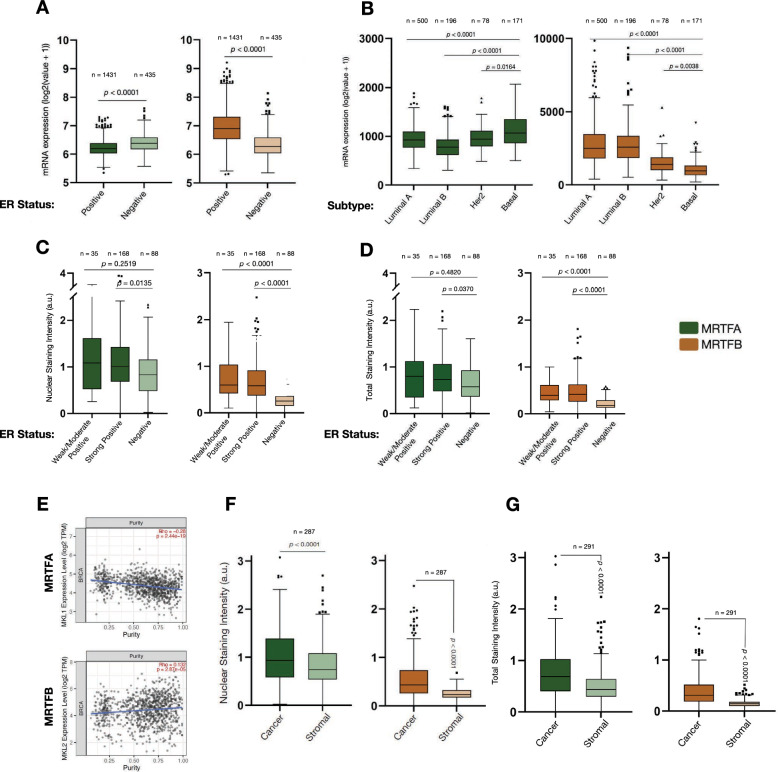
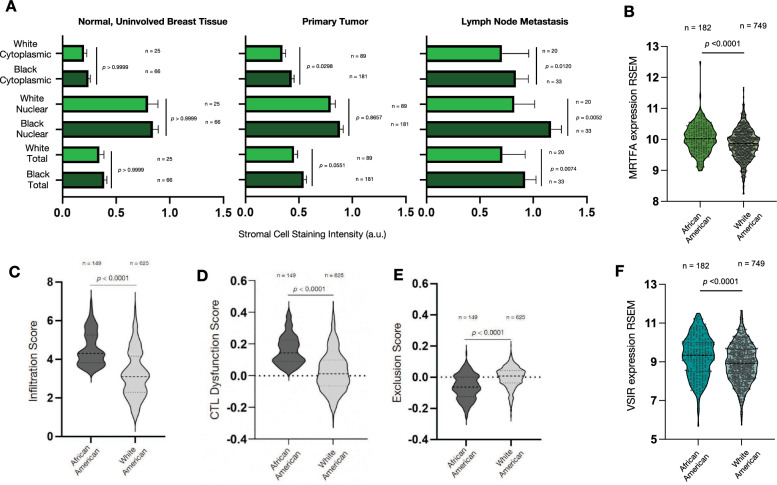
Results: We found that in human tumors, MRTFA/B are concurrently activated in cancer cells, but they show distinct patterns of expression across different histological subtypes and in the cells of the TME. Importantly, MRTFA expression was elevated in metastatic tumors of African American patients, who disproportionately die from breast cancer. Interestingly, in contrast to publicly available mRNA expression data, MRTFA was similarly expressed across estrogen receptor (ER) positive and negative breast tumors, while MRTFB expression was highest in ER+ breast tumors. Furthermore, MRTFA was specifically expressed in the perivascular antigen-presenting cells (APCs), which has been previously associated with immune suppression and breast cancer progression. We also found that MRTFA expression correlated with the expression of the immune checkpoint protein V-set immunoregulatory receptor (VSIR) in the TCGA data and found that MRTFA activity promotes VSIR expression in THP-1 monocytes and cultured HEK293 cells.

Conclusions: Our results provide unique insights into how MRTFA and MRTFB promote metastasis in human cancer, the differences of their expression patterns, and their immune suppressive function within the breast cancer TME. Our results will guide future studies on targeting MRTFA/B transcriptional activity and the resulting immune suppression in breast cancer.

Keywords: Antigen presenting cells; Breast cancer; DCIS; Early-stage; Immune checkpoint; MAL; MKL1; MKL2; MRTFA; MRTFB; Metastasis; Myocardin related transcription factors; SRF; Tumor microenvironment; VISTA; VSIR.


Conflict of interest statement

Declarations. Competing interests: Dr. Hoskins reports non-financial research support from Agendia outside the submitted work; financial support to the institution from Merck, Novartis, Abbvie, and Genentech outside the submitted work for clinical trials. Other authors declare no conflicts of interest

Figures

Fig. 1
Fig. 1
MRTFA and MRTFB show distinct expression patterns in the normal mammary gland. A Schematic representation of selected characteristics of patient cohort. B Illustrative summary of methods to image MRTFA and MRTFB in the tumor microenvironment. C Representative images of expression patterns of MRTFA and MRTFB in the normal mammary gland and its compartments: MRTFA (Opal 520) in green, MRTFB (Opal 620) in cyan, panCK (Opal 690) in red, and DAPI in blue. Asterisks (*) represent lumen of mammary epithelium and arrowheads () point to the location of contractile myoepithelial cells. D Representative images of expression patterns of MRTFA and MRTFB in mammary tissue, Invasive Ductal Carcinoma, and lymph node metastases: MRTFA (Opal 520) in green, MRTFB (Opal 620) in cyan, panCK (Opal 690) in red, and DAPI in blue
Fig. 2
Fig. 2
Subcellular segmentation reveals a correlation between MRTFA and MRTFB staining in tumor cells and abundant nuclear localization. A Workflow for nuclear and cytoplasmic segmentation of 4-color multiplex immunofluorescence in preparation for statistical and bioinformatic analyses, including training of HALO AI to recognize panCK-positive tumor regions versus panCK-negative benign regions of cores. B Violin plot of calculated staining intensity ratios (quotient of nuclear staining intensity and cytoplasmic staining intensity) for MRTFA and MRTFB in panCK-positive tumor cells of primary tumor cores (n = 291). Median staining intensity ratios greater than 1 suggest activation and abundant nuclear expression. C Violin plot showing distribution of Pearson correlation coefficients of average nuclear MRTFA and MRTFB staining intensities in panCK-positive tumor cells of primary tumor cores (n = 289). Mann–Whitney test used to calculate p-values. D Pearson correlation plot and simple linear regression of average nuclear MRTFA and MRTFB staining intensities in panCK-positive tumor cells of primary tumor cores (n = 289)
Fig. 3
Fig. 3
Clinical and demographic correlates of MRTFA and MRTFB expression in lymph node metastases. A Pearson correlation plots of primary tumor nuclear staining intensity and matching lymph node metastasis nuclear staining intensity of MRTFA and MRTFB for 53 cases. Dotted lines signify 99% confidence interval. Cases were categorized into “Low MRTFA/B” and “High MRTFA/B” groups based on falling above or below the median nuclear lymph node staining intensity. B Chart with results from a series of Fisher’s exact tests run for patient demographic and tumor characteristics variables. Cases that did not have data available for every variable tested for were excluded from the analysis (n = 8). C Pearson correlation plots of primary tumor nuclear staining intensity and matching lymph node nuclear staining intensity of MRTFA and MRTFB for self-identified Black/African American patients (n = 31) and White patients (n = 18). Dotted lines signify 99% confidence interval. D Multiple linear regression model for nuclear MRTFA lymph node intensity with patient demographic and tumor characteristics predictor variables. E Multiple linear regression results with top five predictor variables for nuclear MRTFA lymph node intensity based on p-value. F Multiple linear regression model for nuclear MRTFB lymph node intensity with patient demographic and tumor characteristics predictor variables. G Multiple linear regression results with top five predictor variables for nuclear MRTFB lymph node intensity based on p-value. Significance level for p-values: * (p < 0.05), ** (p < 0.01), *** (p < 0.001), **** (p < 0.0001)
Fig. 4
Fig. 4
MRTFA and MRTFB have specific expression patterns based on ER status. A Box plots (Tukey presentation) for mRNA expression of MRTFA and MRTFB among estrogen receptor-positive (n = 1431) and estrogen receptor-negative (n = 435) invasive breast cancer cases. Data accessed via Molecular Taxonomy of Breast Cancer International Consortium (METABRIC) and Mann–Whitney test used to calculate p-values. B Box plots (Tukey presentation) for mRNA expression of MRTFA and MRTFB among Luminal A (n = 500), Luminal B (n = 196), Her2 (n = 78) and Basal (n = 171) molecular subtypes of breast cancer. Data accessed via The Cancer Genome Atlas (TCGA) and Kruskal–Wallis test used to calculate p-values. C Box plots (Tukey presentation) for nuclear staining intensity and total staining intensity (D) of MRTFA and MRTFB in panCK-positive tumor cells of primary tumor cores. Immunohistochemistry was used to identify tumors’ estrogen-receptor status as weak or moderate positive (1–10% and 11–50% staining, n = 35), strong positive (51–100% staining, n = 168), or negative (0% staining, n = 88). Kruskal–Wallis test used to calculate p-values. E Dot plot of all TCGA invasive breast cancer samples’ tumor purity as calculated by the TIMER algorithm as a function of MRTFA (MKL1) and MRTFB (MKL2) gene expression. F Box plots (Tukey presentation) for nuclear staining intensity and total staining intensity (G) of MRTFA and MRTFB in cancer and stromal compartments of primary tumor cores. Mann–Whitney test used to calculate p-values
Fig. 5
Fig. 5
MRTFA shows a distinct expression pattern in antigen presenting cells in the tumor microenvironment. A Single-cell transcriptomic data showing scaled mean expression of and percent of cells expressing MRTFA and MRTFB in immune, structural, and antigen-presenting cell types of the tumor microenvironment (n = 26). Data accessed via Broad Institute Single Cell Portal. B Dendritic Cell (DC) and cancer associated fibroblast (CAF) enrichment scores based on TIMER algorithm as a function of MRTFA and MRTFB expression without tumor purity adjustments. CE Multiplex image of C an invasive breast cancer sample from one patient included in the BCWG UIC-001-TMA (Scale bar, 50 µm) and D in a ductal carcinoma in situ sample (Scale bar, 100 µm for large view and scale bar, 50 µm for insets) and E in a lymph node metastasis sample from CHTN_BrCaProg3 TMA showing cancer cells (panCK, red), endothelial cells (CD31, magenta), antigen presenting cells (HLA-DRA, yellow) and MRTFA (green) and MRTFB (cyan). * shows the nearby DCIS lesion, rectangle shows the area of inset for the bottom panels
Fig. 6
Fig. 6
MRTFA Activates VSIR expression in APCs. A Single cell RNA sequencing data showing expression of several immune suppressor proteins. Data accessed via Broad Institute Single Cell Portal. B Correlation between MRTFA and VSIR gene expression in TCGA invasive breast cancer dataset. C Masson’s Trichrome staining of DCIS sample (*: tumor, yellow arrows: Collagen fibers). D Left Panel: Fibronectin staining of the same tumor as in (C); Right Panel: normal mammary tissue on the same TMA (*: tumor, white arrows: fibronectin positive fibers near the blood vessel). E mRNA fold change of each gene normalized to GAPDH in dendritic cell differentiated THP-1 cells that adhered to tissue culture plate without (control) or with fibronectin. *: p < 0.05. Each value is a different biological replicate (n = 7 per condition) that was done in triplicate. P-values are calculated by Mann–Whitney test. Error bars: S.E.M. F Transcription factor density plots showing SRF binding sites in the promoter region of human VSIR gene. Histone 3 Lysine 27 acetylation (H3K27Ac) show accessibility of chromatin regions, red, orange and yellow blocks in candidate cis-regulatory elements (cCREs) show promoter, and proximal cis enhancers respectively, JASPAR peaks show predicted SRF binding sites, ReMap density shows experimentally validated SRF binding sites by ChIP in experiments listed in purple font. Data accessed via http://genome.ucsc.edu. Session URL: https://genome.ucsc.edu/cgi-bin/hgTracks?db=hg38&lastVirtModeType=default&lastVirtModeExtraState=&virtModeType=default&virtMode=0&nonVirtPosition=&position=chr10%3A71761034%2D71778343&hgsid=1848347878_DsujX4MqToOVpoNLPdbawFAGvIeA. G Schematic showing SRF dependent and independent modes of MRTFA transcriptional activity. H mRNA fold change for each gene listed in HEK293 cells expressing WT or Y238 A mutant MRTFA. Results are representative of two biological replicates conducted in three technical replicates. Error bars: Standard deviation
Fig. 7
Fig. 7
Immune exhaustion and MRTFA expression are elevated in tumors and the stroma of African American breast cancer patients. A MRTFA staining intensity of stromal (panCytokeratin negative) cells in the indicated selection of cores including normal/uninvolved breast tissue, primary tumor cores and lymph node metastasis cores in the BCWG UIC-001-TMA. B MRTFA expression values C Cytotoxic T-cell Dysfunction D T-cell Exclusion and E T-cell infiltration scores and F VSIR expression values of breast cancer patients’ tumors in TCGA separated by race. P-values are calculated by Mann–Whitney test. BF Data accessed via cBioportal

References

    1. Giaquinto AN, et al. Breast cancer statistics, 2022. CA Cancer J Clin. 2022;72:524–41. 10.3322/caac.21754. - PubMed
    1. Hoskins KF, Danciu OC, Ko NY, Calip GS. Association of Race/Ethnicity and the 21-gene recurrence score with breast cancer-specific mortality among US women. JAMA Oncol. 2021;7:370–8. 10.1001/jamaoncol.2020.7320. - PMC - PubMed
    1. Dillekas H, Rogers MS, Straume O. Are 90% of deaths from cancer caused by metastases? Cancer Med. 2019;8:5574–6. 10.1002/cam4.2474. - PMC - PubMed
    1. Mani K, et al. Causes of death among people living with metastatic cancer. Nat Commun. 2024;15:1519. 10.1038/s41467-024-45307-x. - PMC - PubMed
    1. Loibl S, Poortmans P, Morrow M, Denkert C, Curigliano G. Breast cancer. Lancet. 2021;397:1750–69. 10.1016/S0140-6736(20)32381-3. - PubMed