. 2025 May 31;12(1):26.
doi: 10.1186/s40779-025-00610-6.

GSTM1 suppresses cardiac fibrosis post-myocardial infarction through inhibiting lipid peroxidation and ferroptosis

Affiliations

GSTM1 suppresses cardiac fibrosis post-myocardial infarction through inhibiting lipid peroxidation and ferroptosis

Kai-Jie Chen et al. Mil Med Res. .

Abstract

Background: Cardiac fibrosis following myocardial infarction (MI) drives adverse ventricular remodeling and heart failure, with cardiac fibroblasts (CFs) playing a central role. GSTM1 is an important member of the glutathione S-transferase (GSTs) family, which plays an important role in maintaining cell homeostasis and detoxification. This study investigated the role and mechanism of GSTM1 in post-MI fibrosis.

Methods: Multi-omics approaches (proteomics/scRNA-seq) identified GSTM1 as a dysregulated target in post-MI fibroblasts. Using a murine coronary ligation model, we assessed GSTM1 dynamics via molecular profiling, such as Western blotting, immunofluorescence, and real-time quantitative polymerase chain reaction. AAV9-mediated cardiac-specific GSTM1 overexpression was achieved through systemic delivery. In vitro studies employed transforming growth factor-β (TGF-β)-stimulated primary fibroblasts with siRNA/plasmid interventions. Mechanistic insights were derived from transcriptomics and lipid peroxidation assays.

Results: The expression of GSTM1 in mouse CFs after MI was significantly down-regulated at both transcriptional and protein levels. In human dilated cardiomyopathy (DCM) patients with severe heart failure, GSTM1 expression was decreased alongside aggravated fibrosis. Overexpression of GSTM1 in post-MI mice improved cardiac function, while significantly reducing infarct size and fibrosis compared with the control group. In vitro models demonstrated that GSTM1 markedly attenuated collagen secretion and activation of fibroblasts, as well as suppressed their proliferation and migration. Further studies revealed that GSTM1 overexpression significantly inhibited the generation of intracellular and mitochondrial reactive oxygen species (ROS) under pathological conditions, suggesting that GSTM1 exerts an antioxidative stress effect in post-infarction fibroblasts. Further investigation of molecular mechanisms indicated that GSTM1 may suppress the initiation and progression of fibrosis by modulating lipid metabolism and ferroptosis-related pathways. Overexpression of GSTM1 significantly reduced lipid peroxidation and free ferrous iron levels in fibroblasts and mitochondria, markedly decreased ferroptosis-related indicators, and alleviated oxidative lipid levels [such as 12-hydroxyeicosapentaenoic acid (HEPE) and 9-, 10-dihydroxy octadecenoic acid (DHOME)] under fibrotic conditions. GSTM1 enhanced the phosphorylation of STAT3, thereby upregulating the downstream expression of glutathione peroxidase 4 (GPX4), reducing ROS production, and mitigating fibroblast activation and phenotypic transformation by inhibiting lipid peroxidation.

Conclusions: This study identifies GSTM1 as a key inhibitor of fibroblast activation and cardiac fibrosis, highlighting its ability to target ferroptosis through redox regulation. AAV-mediated GSTM1 therapy demonstrates significant therapeutic potential for improving outcomes post-MI.

Keywords: Cardiac fibrosis; Ferroptosis; GSTM1; Glutathione peroxidase 4; Lipid peroxidation; Myocardial infarction (MI); Reactive oxygen species (ROS).


Conflict of interest statement

Declarations. Ethics approval and consent to participate: All procedures involving animals have been approved by the Zhejiang University Animal Care and Utilization Committee (2022-113). All procedures involving human samples were approved by the Human Research Ethics Committee of the Second Affiliated Hospital of Zhejiang University School of Medicine (2014-160). Consent for publication: Not applicable. Competing interests: The authors declare that they have no competing interests.

Figures

Fig. 1
Fig. 1
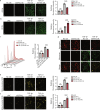
GSTM1 decreased significantly in injured cardiac fibroblasts both in vivo and in vitro. a The expression changes of GSTM1 and POSTN in mouse fibroblasts at different time points after MI were analyzed by single-cell sequencing. b Western blotting analysis of the expression levels of GSTM1 and fibrosis-related indicators in normal human heart tissue and heart tissue of patients with advanced heart failure and their quantitative analysis with 3 biological repeats (n = 3). c Western blotting representative images and quantitative analysis of GSTM1 and related fibrotic markers in C57BL/6J mice in the sham group and at 3, 7, and 28 d following MI, with 3 biological repeats (n = 3). d qPCR was used to detect the changes of mRNA levels of GSTM1 and fibrosis-related indicators in the sham group and at 3, 7, and 28 d after MI in the heart infarction area of mice with 3 biological repeats (n = 3). e Immunofluorescence staining representatives of sham group and heart infarction area at 3, 7, and 28 d after mouse MI. The red fluorescence is GSTM1, the green fluorescence is vimentin, and the blue fluorescence is DAPI (Scale bar = 50 μm). Quantitative statistics of GSTM1 and vimentin were conducted with 5 biological repeats (n = 5). f Western blotting and quantitative analysis were performed to detect GSTM1 and fibrosis index protein levels in primary mouse fibroblasts stimulated by TGF-β at different time points. Statistical differences between the two groups were determined using the Student’s t-test (b). Comparisons among three or more groups were conducted using one-way ANOVA (Fig. 1c, d, e, f). Data are presented as mean ± standard error. *P < 0.05, **P < 0.01, ***P < 0.001, ****P < 0.0001. NC negative control, DCM dilated cardiomyopathy, MI myocardial infarction, DAPI 4′,6-diamidino-2-phenylindole, COL1A1 collagen type I alpha 1 chain, POSTN periostin, α-SMA α-smooth muscle actin, GSTM1 glutathione S-transferase mu 1, GAPDH glyceraldehyde-3-phosphate dehydrogenase, TGF-β transforming growth factor-β
Fig. 2
Fig. 2
Knockdown of GSTM1 exacerbates cardiac fibroblast activation. a qPCR analysis of GSTM1 and fibrosis index mRNA levels in mouse fibroblasts stimulated by TGF-β for 48 h after siNC and siGSTM1 pretreatment, with 6 biological repeats (n = 6). b Western blotting and quantitative analysis of GSTM1 and fibrosis index protein levels in mouse fibroblasts stimulated by TGF-β for 48 h after siNC and siGSTM1 pretreatment, with 6 biological repeats (n = 6). c Immunofluorescence representation of the effect of GSTM1 knockdown on fibroblast activation under TGF-β stimulation, vimentin was red fluorescence, and DAPI was blue fluorescence (Scale bar = 100 μm). Quantitative statistical map of relative fluorescence intensity of vimentin, the activation index of fibroblast stained by immunofluorescence, with 6 biological repeats (n = 6). d The representative map of the effect of GSTM1 knockdown on the migration ability of cardiac fibroblasts was detected by scratch test and photographed 24 h after scratching (Scale bar = 50 μm). Quantitative statistical map of the scratch experiment: the larger the relative migration distance, the stronger the migration ability of surface cells, with 6 biological repeats (n = 6). e The immunofluorescence staining representation of GSTM1 knockdown on cell proliferation was detected, DAPI was blue fluorescence, and Ki-67 was red fluorescence (Scale bar = 75 μm). Quantitative statistical map of Ki-67 positive cells: the more positive cells, the stronger the proliferation ability of the surface cells, with 6 biological repeats (n = 6). Statistical differences among the four groups were conducted using one-way ANOVA. Data are expressed as mean ± standard error. ns non-significance, *P < 0.05, **P < 0.01, ***P < 0.001, ****P < 0.0001. NC negative control, DAPI 4′,6-diamidino-2-phenylindole, COL1A1 collagen type I alpha 1 chain, COL3 A1 collagen type III alpha 1 chain, POSTN periostin, α-SMA α-smooth muscle actin, GSTM1 glutathione S-transferase mu 1, GAPDH glyceraldehyde-3-phosphate dehydrogenase, TGF-β transforming growth factor-β
Fig. 3
Fig. 3
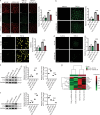
Overexpression of GSTM1 inhibits CF activation. a qPCR was used to detect the mRNA levels of GSTM1 and fibrosis markers in mouse fibroblasts stimulated with TGF-β for 48 h after transfection with NC OE and GSTM1 OE plasmids, with 6 biological repeats (n = 6). b Western blotting was used to detect the protein levels of GSTM1 and fibrosis markers in mouse fibroblasts stimulated with TGF-β for 48 h after transfection with NC OE and GSTM1 OE plasmids. Quantitative analysis of protein expression levels of GSTM1, COL1A1, POSTN, and α-SMA was performed, with 3 biological repeats (n = 3). c Immunofluorescence representation of the effect of overexpression of GSTM1 on fibroblast activation under TGF-β stimulation, with red fluorescence for vimentin and blue fluorescence for DAPI. Quantitative statistical diagram of the relative fluorescence intensity of vimentin, the activation index of fibroblasts stained by immunofluorescence (Scale bar = 100 μm), with 6 biological repeats (n = 6). d The representative map of the effect of GSTM1 overexpression on the migration ability of CFs was detected by scratch test and photographed 24 h after scratching (Scale bar = 50 μm). Quantitative statistical map of the scratch experiment: the larger the relative migration distance, the stronger the migration ability of surface cells, with 3 biological repeats (n = 3). e Immunofluorescence staining representation of GSTM1 overexpression on cell proliferation, with red fluorescence for Ki-67 and blue fluorescence for DAPI. Quantitative statistical diagram of Ki-67 positive cells: the more positive cells, the stronger the proliferation ability of the surface cells (Scale bar = 75 μm), with 6 biological repeats (n = 6). Statistical differences among the four groups were conducted using one-way ANOVA. Data are expressed as mean ± standard error. ns non-significance, **P < 0.01, ***P < 0.001, ****P < 0.0001. NC negative control, DAPI 4′,6-diamidino-2-phenylindole, COL1A1 collagen type I alpha 1 chain, COL3 A1 collagen type III alpha 1 chain, POSTN periostin, α-SMA α-smooth muscle actin, GSTM1 glutathione S-transferase mu 1, TGF-β transforming growth factor-β
Fig. 4
Fig. 4
GSTM1 suppresses ROS production in TGF-β-induced fibroblast activation. a Intracellular ROS levels in mouse fibroblasts stimulated by TGF-β after transfection with NC OE and GSTM1 OE. The green fluorescence indicated ROS in the cytoplasm, and the higher the fluorescence intensity, the higher the ROS content in the cytoplasm (Scale bar = 50 μm). Quantitative analysis of the relative fluorescence intensity of intracellular ROS was performed, with 6 biological repeats (n = 6). b Intracellular ROS levels in mouse fibroblasts stimulated by TGF-β after transfection with si-NC and si-GSTM1. Quantitative analysis of the relative fluorescence intensity of intracellular ROS was conducted, with 6 biological repeats (n = 6). c Intracellular ROS was detected by flow cytometry. d After staining with JC-1 reagent, it was observed under a fluorescence microscope (red fluorescence is JC-1 polymerization, green fluorescence is JC-1 monomer) (Scale bar = 50 μm). e Mitochondria ROS levels in mouse fibroblasts stimulated by TGF-β after transfection with NC OE and GSTM1 OE. The yellow fluorescence represents the mitochondrial ROS content, and the stronger the fluorescence intensity, the higher the ROS production (Scale bar = 50 μm). Quantitative analysis of the relative fluorescence intensity of mitochondrial ROS was performed, with 6 biological repeats (n = 6). f Mitochondria ROS levels in mouse fibroblasts stimulated by TGF-β after transfection with si-NC and si-GSTM1 (Scale bar = 50 μm). Quantitative analysis of the relative fluorescence intensity of mitochondrial ROS was conducted, with 6 biological repeats (n = 6). Statistical differences among the four groups were conducted using one-way ANOVA. Data are expressed as mean ± standard error. ns non-significance, *P < 0.05, **P < 0.01, ***P < 0.001, ****P < 0.0001. NC negative control, DCFH 2′,7′-dichlorodihydrofluorescein diacetate, ROS Reactive oxygen species, GSTM1 glutathione S-transferase mu 1, TGF-β transforming growth factor-β
Fig. 5
Fig. 5
Lipid peroxidation and ferroptosis induce excessive activation of CFs. a GO biological process bubble map of RNA-seq sequencing analysis. b GO cellular component bubble map for RNA-seq analysis. c GO molecular function bubble map for RNA-seq analysis. d Bubble map of KEGG enrichment signal pathway obtained by RNA-seq analysis. e Fibroblasts were treated with TGF-β, ferroptosis agonist erastin, and TGF-β + ferroptosis inhibitor ferrostatin-1, and the representative graphs of fibrosis indexes were observed by Western blotting. Quantitative analysis of fibrosis-related indicators COL1A1, α-SMA, and GSTM1 was shown, with 6 biological repeats (n = 6). Statistical differences among the four groups were conducted using one-way ANOVA. Data are expressed as mean ± standard error. ns non-significance, ****P < 0.0001. NC negative control, GO Gene Ontology, KEGG Kyoto Encyclopedia of Genes and Genomes, FAD flavin adenine dinucleotide, COL1A1 collagen type I alpha 1 chain, α-SMA α-smooth muscle actin, GSTM1 glutathione S-transferase mu 1, GAPDH glyceraldehyde-3-phosphate dehydrogenase, TGF-β transforming growth factor-β
Fig. 6
Fig. 6
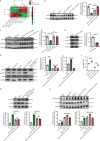
GSTM1 mitigates fibrosis by alleviating lipid peroxidation and ferroptosis. a Intracellular lipid peroxidation levels in mouse fibroblasts stimulated by TGF-β after transfection with NC OE and GSTM1 OE was detected by C11 probe, with red representing non-oxidized state and green representing peroxide state (Scale bar = 250 μm). b The fluorescence staining pattern of mitochondrial lipid peroxidation detected by MitoPeDPP probe (Scale bar = 50 μm). c Fluorescence staining diagram of FerroOrange probe for the detection of free ferrous ion intracellular levels (Scale bar = 50 μm). d Fluorescence staining diagram of Mito-FerroGreen probe for the detection of free ferrous ion levels in mitochondria (Scale bar = 250 μm). e Western blotting was used to detect the ferroptosis level of mouse fibroblasts stimulated by TGF-β for 48 h after pretreatment with NC OE and GSTM1 OE plasmids transfection. Quantitative statistics of NOX1 and FTH proteins were performed, with 6 biological repeats (n = 6). f Western blotting was used to detect the ferroptosis level of mouse fibroblasts stimulated by TGF-β for 48 h after pretreatment with siNC and siGSTM1. Protein quantitative statistics of NOX1 and FTH were conducted, with 6 biological repeats (n = 6). g The differential metabolite heat map of oxidative lipid metabolism between the GSTM1 overexpression and the control group. Statistical differences among the four groups were conducted using one-way ANOVA. Data are expressed as mean ± standard error. ns non-significance, *P < 0.05, ****P < 0.0001. HDHA hydroxyacyl-CoA dehydrogenase, EPA eicosapentaenoic acid, HETE hydroxyeicosatetraenoic acid, HEPE hydroxyeicosapentaenoic acid, HOTE hydroxyoctadecatrienoic acid, ETE eicosatetraenoic acid, OXO oxoicosanoic, PG prostaglandin, ODE octadecadienoic acid, DHOME dihydroxy octadecenoic acid, DHA docosahexaenoic acid, EPA eicosapentaenoic acid, AA arachidonic acid, NC negative control, FTH ferritin heavy chain, NOX1 NADPH oxidase 1, GSTM1 glutathione S-transferase mu 1, GAPDH glyceraldehyde-3-phosphate dehydrogenase, TGF-β transforming growth factor-β
Fig. 7
Fig. 7
GSTM1 induces GPX4 expression through the GSH/ROS/STAT3 pathway. a Heatmap of differential genes associated with lipid peroxidation obtained by RNA-seq analysis. b Western blotting and quantitative analysis of the effects of GPX4 on TGF-β stimulation with ROS and overexpressed GSTM1, with 6 biological repeats (n = 6). c The effect of ROS on STAT3 phosphorylation was detected by Western blotting. Quantitative analysis of proteins was performed with 6 biological repeats (n = 6). d Direct effect of STAT3 dephosphorylation on GPX4. Quantitative analysis of proteins was performed with 6 biological repeats (n = 6). e Effect of GSTM1 on STAT3/GPX4 pathway. Quantitative analysis of proteins was performed with 6 biological repeats (n = 6). f The effect of overexpression of GSTM1 on GSH production in primary fibroblasts under physiological conditions and in the pathological fibrosis model was detected by the kit. g ROS scavenger combination with GSTM1 overexpression. Quantitative analysis of proteins was performed with 6 biological repeats (n = 6). h Western blotting analysis to determine whether GSTM1 inhibits fibrosis by interfering with lipid peroxidation. Quantitative analysis of proteins was performed with 6 biological repeats (n = 6). Comparisons among three or more groups were conducted using one-way ANOVA. Data are expressed as mean ± standard error. ns non-significance, ***P < 0.001, ****P < 0.0001. NC negative control, GSH glutathione, ROS reactive oxygen species, GSTM1 glutathione S-transferase mu 1, STAT3 signal transducer and activator of transcription 3, GPX4 glutathione peroxidase 4, GAPDH glyceraldehyde-3-phosphate dehydrogenase, Usf2 upstream transcription factor 2, Fitm2 fat storage inducing transmembrane protein 2, Tspo translocator protein, Hmgcs1 3-hydroxy-3-methylglutaryl-CoA synthase 1, Cyp51 cytochrome P450, family 51, Msmo1 methylsterol monooxygenase 1, Dgat2 diacylglycerol O-acyltransferase 2, Acads acyl-CoA dehydrogenase short chain, Stc2 stanniocalcin 2, Acox2 acyl-CoA oxidase 2, Ehhadh enoyl-CoA hydratase and 3-hydroxyacyl CoA dehydrogenase, Sphk1 sphingosine kinase 1, Pxdn peroxidasin, Ptgs2 prostaglandin-endoperoxide synthase 2, TGF-β transforming growth factor-β
Fig. 8
Fig. 8
AAV-mediated GSTM1 overexpression protects infarcted hearts by alleviating fibrosis. a Echocardiography at 7, 14, and 28 d after MI of mice with over-expression of GSTM1-AAV9 virus injected in the tail vein compared with the negative injection control. Timestamp = 100 ms. Echogram of mice ventricular ejection fraction (EF), fraction shorting (FS), left ventricular internal dimension at end-diastole (LVIDd), and left ventricular internal dimension at end-systole (LVIDs), with 6 biological repeats (n = 6). b Masson and Sirius red staining maps and statistical maps of infarct size were performed on the heart tissues of mice 28 d after myocardial infarction (Scale bar = 1 mm), with 6 biological repeats (n = 6). Statistical differences between the two groups were determined using the Student’s t-test. Data are expressed as mean ± standard error. ns non-significance, *P < 0.05, **P < 0.01. AAV adeno-associated virus, MI myocardial infarction, Ctrl control, GSTM1 glutathione S-transferase mu 1
Fig. 9
Fig. 9
By intervening in the GSH/ROS/STAT3/GPX4 pathway in cardiac fibroblasts, GSTM1 inhibits the production of lipid peroxidation, thus inhibiting the activation and phenotype transformation of fibroblasts, improving the cardiac function after myocardial infarction and alleviating the occurrence and development of fibrosis. GSTM1 glutathione S-transferase mu 1, GSH glutathione, ROS reactive oxygen species, GPX4 glutathione peroxidase 4, GSSG oxidized glutathione, GSR glutathione reductase, STAT3 signal transducer and activator of transcription 3

References

    1. GBD 2017 Causes of Death Collaborators. Global, regional, and national age-sex-specific mortality for 282 causes of death in 195 countries and territories, 1980–2017: a systematic analysis for the Global Burden of Disease Study 2017. Lancet. 2018;392(10159):1736–88. - PMC - PubMed
    1. Townsend N, Kazakiewicz D, Lucy Wright F, Timmis A, Huculeci R, Torbica A, et al. Epidemiology of cardiovascular disease in Europe. Nat Rev Cardiol. 2022;19(2):133–43. - PubMed
    1. Zhao D. Epidemiological features of cardiovascular disease in Asia. JACC Asia. 2021;1(1):1–13. - PMC - PubMed
    1. Zile MR, Baicu CF, Ikonomidis JS, Stroud RE, Nietert PJ, Bradshaw AD, et al. Myocardial stiffness in patients with heart failure and a preserved ejection fraction: contributions of collagen and titin. Circulation. 2015;131(14):1247–59. - PMC - PubMed
    1. González A, Schelbert EB, Díez J, Butler J. Myocardial interstitial fibrosis in heart failure: biological and translational perspectives. J Am Coll Cardiol. 2018;71(15):1696–706. - PubMed

Substances