. 2025 May 22;53(10):gkaf449.
doi: 10.1093/nar/gkaf449.

Timed chromatin invasion during mitosis governs prototype foamy virus integration site selection and infectivity

Affiliations

Timed chromatin invasion during mitosis governs prototype foamy virus integration site selection and infectivity

Floriane Lagadec et al. Nucleic Acids Res. .

Abstract

Selection of a suitable chromatin environment during retroviral integration is a tightly regulated process. Most retroviruses, including spumaretroviruses, require mitosis for nuclear entry. However, whether intrinsic chromatin dynamics during mitosis modulates retroviral genome invasion is unknown. Previous work uncovered critical interactions of prototype foamy virus (PFV) Gag with nucleosomes via a highly conserved arginine anchor residue. Yet, the regulation of Gag-chromatin interaction and its functional consequences for spumaretrovirus biology remain obscure. Here, we investigated the kinetics of chromatin binding by Gag during mitosis and proviral integration in synchronized cells. We showed that alteration of Gag affinity for nucleosome binding induced untimely chromatin tethering during mitosis, decreased infectivity, and redistributed viral integration sites to markers associated with late replication timing of chromosomes. Mutant Gag proteins were, moreover, defective in their ability to displace the histone H4 tail from the nucleosome acidic patch of highly condensed chromatin. These data indicate that the chromatin landscape during Gag-nucleosome interactions is important for PFV integration site selection and that spumaretroviruses evolved high-affinity chromatin binding to overcome early mitosis chromatin condensation.


Conflict of interest statement

None declared.

Figures

Graphical Abstract
Graphical Abstract
Figure 1.
Figure 1.
PFV Gag CBS interaction with a human nucleosome. (A) Overview of the PFV Gag CBS–nucleosome complex structure shown as a surface representation colored as electrostatic potential (left; database accession code 5MLU). Cartoon representation of the acidic patch engaged by PFV Gag CBS (right). PFV Gag CBS peptide is colored in yellow; histones H2A, H2B, H3, and H4 are shown in pale yellow, red, blue, and green, respectively. (B) Amino acid sequence alignment of Gag CBSs. PFV: prototype foamy virus; SFV: simian foamy virus; pve, Pan troglodytes verus; mfu, Macaca fuscata; cae, Chlorocebus aethiops; cni, Cercopithecus nictitans; ggo, Gorilla gorilla gorilla; ssc, Saimiri sciureus; a, Ateles species; cja, Callithrix jacchus; ocr, Otolemur crassicaudatus; BFV, bovine foamy virus; EFV, equine foamy virus; FFV, feline foamy virus; ERV Spuma Spu, endogenous retrovirus Spuma Sphenodon punctatus; Cbo, Ciconia boyciana; SloEFV, sloth endogenous foamy virus; CoeEFV, Coelacanth endogenous foamy virus. The alignment was performed using ESPript 3.
Figure 2.
Figure 2.
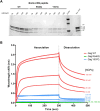
PFV Gag residue Y537 contributes significantly to the interaction with nucleosomes. (A) Streptavidin pull-down of recombinant nucleosomes with biotinylated Gag CBS peptides in the presence of 75–150 mM NaCl. (B) BLI sensorgram of immobilized Gag CBS peptides and different concentrations of recombinant NCP. The binding intensity (nm) is normalized with a buffer condition without NCP. Results are representative of three independent experiments.
Figure 3.
Figure 3.
Conserved Gag CBS residues are essential for timely mitotic chromatin capture. Gag localization during PFV infection. G2/M-phase synchronized HT1080 cells were transduced with PFV particles encoding WT, R540Q, or Y537Q Gag and fixed at different time points after drug release, corresponding to different mitotic phases indicated in orange. Gag proteins were detected using polyclonal anti-PFV Gag antiserum (green); the nuclear envelope was stained with anti-Lamin A/C antibodies (red) and cellular DNA with DAPI (gray). White arrows show MTOC accumulation of PFV Gag. Scale bars: 20 μm. Percentages of chromatin-bound Gag are indicated for each mitotic phase. See “Materials and methods” section for detailed information on quantification. Results are representative of those observed across at least five independent experiments.
Figure 4.
Figure 4.
Conserved PFV Gag CBS residues are required for optimal infectivity. (A) Six days post-infection, GFP-positive cells were counted by flow cytometry as relative measures of infectivity. Error bars are SDs determined from at least three independent infections; the WT values in each experiment were set to 100%. (B) Quantitative PCR of integrated vDNA, 6 days after HT1080 infection, with PFV vector particles carrying WT, R540Q, or Y537Q Gag with WT IN or WT Gag containing virus with catalytically inert D185N/ E221Q IN (IN-NQ). Results are expressed as percentage relative to the WT condition, which was set to 100%. Statistical analyses were performed using the ordinary one-way ANOVA, with Tukey’s multiple comparisons tests (***P < .0005; ****P < .0001).
Figure 5.
Figure 5.
Integration site distributions of WT and Gag CBS mutant viruses. Integration frequencies normalized to in silico-calculated RICs are shown as a heatmap. Values >1 (red color) indicate enrichment of PFV sites compared to random, whereas values <1 (white color) represent features avoided by PFV for integration. Genes were divided into five groups based on expression, with bin1 being top-expressed genes. Human cytobands specific to genome build hg38 are shown as acen, gnen, gp25, gp50, gp75, and gp100. TSS, GD, LAD, and SPAD represent transcription start site, gene density (±0.5 Mb), lamina-associated domain, and speckle-associated domain.
Figure 6.
Figure 6.
Chromosomal distributions of PFV proviruses. (A) PFV integration sites % per Mb (Y-axis) of indicated human chromosomes (X-axis) are shown for R540Q and Y537Q viruses along with WT PFV and RIC. Significant differences in chromosomal targeting between R540Q and Y537Q is shown (Fisher’s exact test; P < .05). (B) PFV integration % per Mb for three chromosomal groups based on replication timing: early, middle, and late replicating (X-axis). PFV integration per Mb for each group is shown (*P < .05 between R450Q and Y537Q; Fisher’s exact test). (C) Chromosomal distribution of RepID ChIP-seq sites per Mb. (D) Correlation between chromosomal distribution of RepID binding sites per Mb and % PFV integration sites per Mb.
Figure 7.
Figure 7.
PFV integration sites within mitotic expressed genes. Mitotic genes were classified at 0 (A, D), 40 (B, E), and 80 (C, F) min if the expression of the gene was ≥1.5 times its expression at 105 min from release of mitotic arrest. PFV genic sites (%) are shown for 50% top-expressed in panels (A)–(C) and 50% bottom-expressed mitotic genes in panels (D)–(F). *, Significant difference in targeting between R540Q and Y537Q (Fisher’s exact test; P < .05).
Figure 8.
Figure 8.
Interaction of the H4 tail to the nucleosome acidic patch prevents Gag Y537Q binding. BLI sensorgram of free nucleosomes (NCP, plain line), saturated with WT H4 tail (residues 2–24) (dashed line) or H4 mut (triple alanine substitution) (dotted line) binding to immobilized (A) WT Gag (red), (B) R540Q Gag (green), and (C) Y537Q Gag (blue) peptides. Binding intensity (nm) was normalized to conditions without NCP. The mean of two independent experiments is plotted.

References

    1. Rethwilm A, Bodem J Evolution of foamy viruses: the most ancient of all retroviruses. Viruses. 2013; 5:2349–74. 10.3390/v5102349. - DOI - PMC - PubMed
    1. Pinto-Santini DM, Stenbak CR, Linial ML Foamy virus zoonotic infections. Retrovirology. 2017; 14:55. 10.1186/s12977-017-0379-9. - DOI - PMC - PubMed
    1. Betsem E, Rua R, Tortevoye P et al. Frequent and recent human acquisition of simian foamy viruses through apes’ bites in Central Africa. PLoS Pathog. 2011; 7:e1002306. 10.1371/journal.ppat.1002306. - DOI - PMC - PubMed
    1. Buseyne F, Betsem E, Montange T et al. Clinical signs and blood test results among humans infected with zoonotic simian foamy virus: a case-control study. J Infect Dis. 2018; 218:144–51. - PubMed
    1. Gessain A, Montange T, Betsem E et al. Case-control study of the immune status of humans infected with zoonotic gorilla simian foamy viruses. J Infect Dis. 2020; 221:1724–33. 10.1093/infdis/jiz660. - DOI - PubMed

LinkOut - more resources