. 2025 May 22;53(10):gkaf444.
doi: 10.1093/nar/gkaf444.

CorrAdjust unveils biologically relevant transcriptomic correlations by efficiently eliminating hidden confounders

Affiliations

CorrAdjust unveils biologically relevant transcriptomic correlations by efficiently eliminating hidden confounders

Stepan Nersisyan et al. Nucleic Acids Res. .

Abstract

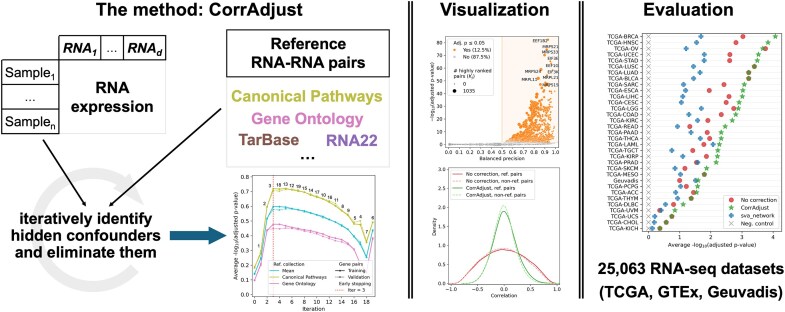
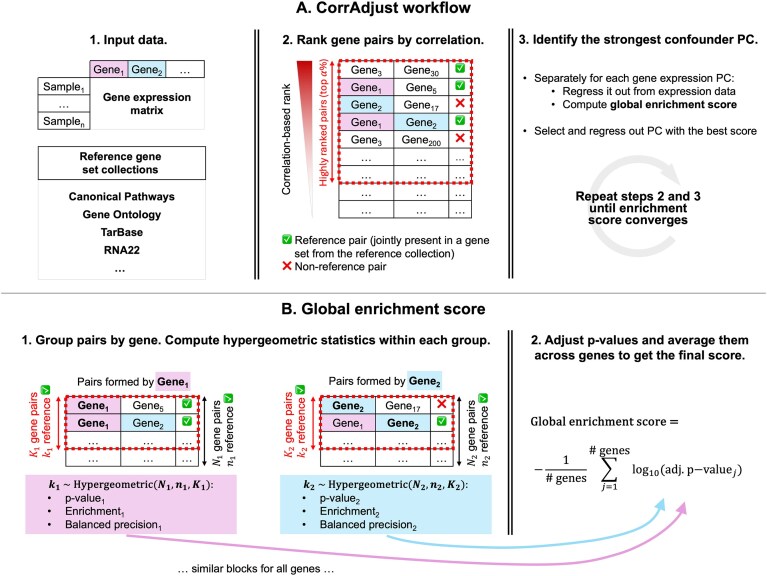
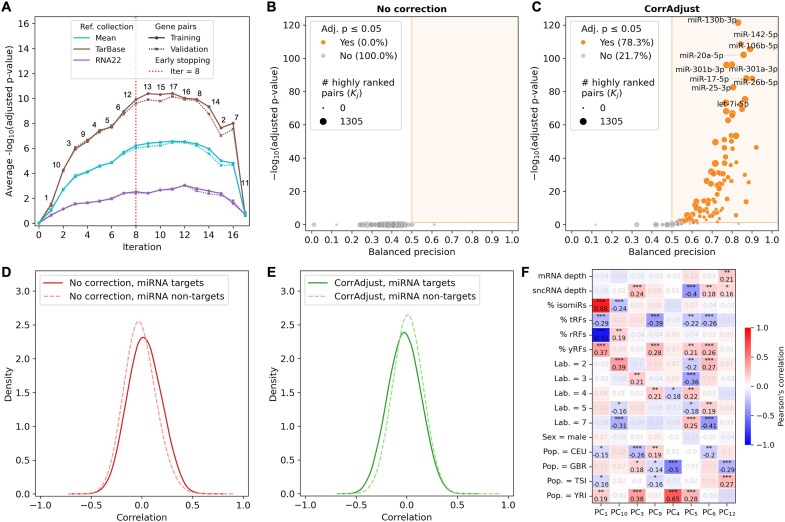
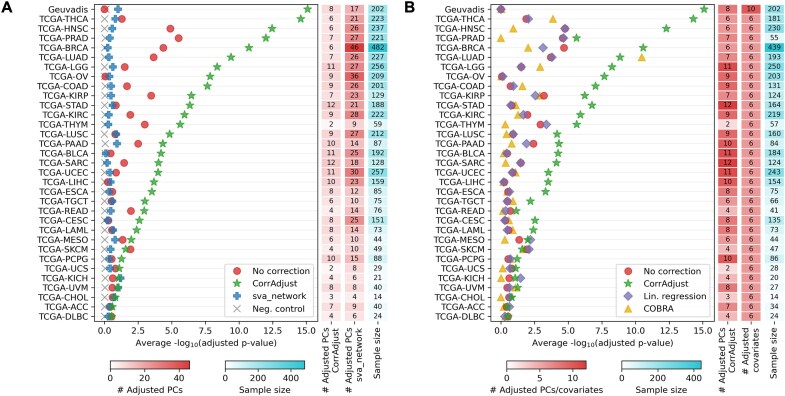
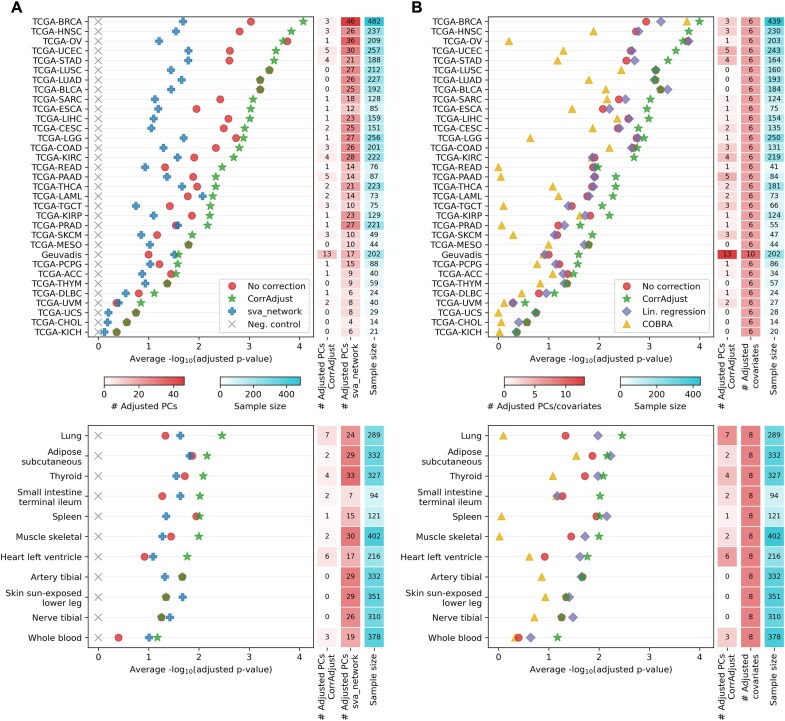
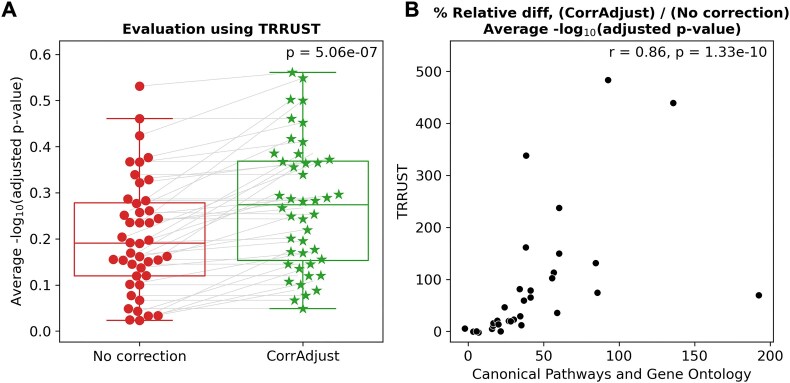
Correcting for confounding variables is often overlooked when computing RNA-RNA correlations, even though it can profoundly affect results. We introduce CorrAdjust, a method for identifying and correcting such hidden confounders. CorrAdjust selects a subset of principal components to residualize from expression data by maximizing the enrichment of "reference pairs" among highly correlated RNA-RNA pairs. Unlike traditional machine learning metrics, this novel enrichment-based metric is specifically designed to evaluate correlation data and provides valuable RNA-level interpretability. CorrAdjust outperforms current state-of-the-art methods when evaluated on 25 063 human RNA-seq datasets from The Cancer Genome Atlas, the Genotype-Tissue Expression project, and the Geuvadis collection. In particular, CorrAdjust excels at integrating small RNA and mRNA sequencing data, significantly enhancing the enrichment of experimentally validated miRNA targets among negatively correlated miRNA-mRNA pairs. CorrAdjust, with accompanying documentation and tutorials, is available at https://tju-cmc-org.github.io/CorrAdjust.


Conflict of interest statement

The authors declare that there are no conflicts of interests to disclose.

Figures

Graphical Abstract
Graphical Abstract
Figure 1.
Figure 1.
The outline of the CorrAdjust method. (A) Inputs to CorrAdjust are a gene expression matrix and reference collections of gene sets. On each iteration, gene pairs are ranked according to their correlation value. Each gene pair is labeled as “reference” (check mark) or “non-reference” (cross mark), depending on whether the genes jointly belong to at least one ground truth set from the reference collection. Next, CorrAdjust identifies the PC of the gene expression matrix, which, upon its residualization, maximizes the global enrichment score. The procedure is repeated until the convergence of the global enrichment score. (B) To compute the global enrichment score, the ranked gene pairs are first grouped into blocks, each centered around one gene (example genes 1 and 2 are highlighted). Hypergeometric distribution-based statistics are then computed for highly ranked pairs (rectangle with dashed borders) in each block, comparing the fraction of reference pairs between the highly ranked pairs and the rest of the block. Note that highly ranked gene pairs are defined based on the full table from step 2 of panel A. Then, the p-values corresponding to all genes are adjusted for multiple testing, log-transformed, and averaged into a global enrichment score.
Figure 2.
Figure 2.
Application of CorrAdjust to mRNA–mRNA correlations computed over the GTEx whole blood dataset. (A) Optimization trajectory of CorrAdjust (training samples). Each iteration (X-axis) corresponds to the selection of one PC (number on top of the curves). Iteration 0 corresponds to uncorrected data. The Y-axis shows global enrichment scores for Canonical Pathways, Gene Ontology, and the average of these scores. (B and C) Volcano plots before and after CorrAdjust correction (test samples, all gene pairs, Canonical Pathways). Each marker represents one gene. The marker area stands for the number of highly ranked gene pairs involving the corresponding gene (top formula image% approach, see “Methods”). The top 10 genes by adjusted p-value are annotated. (D and E) Kernel density estimation and cumulative distribution function of gene–gene correlations before and after CorrAdjust correction. Solid lines correspond to the pairs of mRNAs that are jointly present in at least one Canonical Pathway. (F) Correlations between identified confounder PCs and known covariates (training samples): post-mortem interval (PMI), RNA integrity number (RIN), sequencing depth, sex, and age group. (G and H) A representative gene pair with a high spurious correlation driven by a confounder (PMI), which disappears after residualizing PC1 from the expression data. (I) Despite a strong impact on a gene–gene correlation, PMI does not distort differential expression analysis (female versus male donor comparison). The p-values were computed using Student’s t-test applied to normalized read counts (no PMI correction).
Figure 3.
Figure 3.
Application of CorrAdjust to miRNA–mRNA correlations computed over the Geuvadis LCLs dataset. (A) Optimization trajectory of CorrAdjust (training samples). Each iteration (X-axis) corresponds to the selection of one PC (the number on top of the curves). Iteration 0 corresponds to uncorrected data. The Y-axis shows global enrichment scores for TarBase, RNA22, and the average of these scores. (B and C) Volcano plots before and after CorrAdjust correction (test samples, all pairs, TarBase). Each marker represents one miRNA. The marker area stands for the number of highly ranked miRNA–mRNA pairs involving the corresponding miRNA (top formula image% approach, see “Methods”). The top 10 miRNAs by adjusted p-value are annotated. (D and E) Kernel density estimation of miRNA–mRNA correlations before and after CorrAdjust correction. Solid lines correspond to pairs of miRNAs and their experimentally validated targets from TarBase. (F) Correlations between identified confounder PCs and known covariates (training samples): mRNA sequencing depth, small non-coding RNA (sncRNA) sequencing depth, composition of sncRNA-omes, laboratory ID, sex, and population.
Figure 4.
Figure 4.
Benchmarking results of CorrAdjust and alternative methods using miRNA–mRNA correlations (test samples, all pairs). (A) Methods for hidden confounders correction. (B) Methods for known covariates correction. The X-axis shows the global enrichment score (average of TarBase and RNA22). The columns to the right of the main plots show the number of PCs adjusted by CorrAdjust, the number of PCs adjusted by the sva_network approach, the number of adjusted known covariates, and the number of samples in the training set.
Figure 5.
Figure 5.
Benchmarking results of CorrAdjust and alternative methods using mRNA–mRNA correlations (test samples, all pairs). (A) Methods for hidden confounders correction. (B) Methods for known covariates correction. The top panels show TCGA and Geuvadis datasets, and the bottom ones show GTEx data. The X-axis shows the global enrichment score (average of Canonical Pathways and Gene Ontology). The columns to the right of the main plots show the number of PCs adjusted by CorrAdjust, the number of PCs adjusted by the sva_network approach, the number of adjusted known covariates, and the number of samples in the training set.
Figure 6.
Figure 6.
Evaluation of CorrAdjust models trained using Canonical Pathways and Gene Ontology on an independent TRRUST reference collection. Each marker on both panels represents one TCGA cancer type, GTEx tissue, or the Geuvadis collection. (A) Global enrichment scores before and after CorrAdjust correction. The p-value in the top-right corner was computed using paired sample Student’s t-test. (B) Relative differences between CorrAdjust-corrected and uncorrected global enrichment scores computed using training reference collections (X-axis) and independent TRRUST collection (Y-axis). The top-right corner shows Spearman’s correlation and the associated p-value.

Similar articles

References

    1. Leek JT, Johnson WE, Parker HS et al. The sva package for removing batch effects and other unwanted variation in high-throughput experiments. Bioinformatics. 2012; 28:882–3. 10.1093/bioinformatics/bts034. - DOI - PMC - PubMed
    1. Risso D, Ngai J, Speed TP et al. Normalization of RNA-seq data using factor analysis of control genes or samples. Nat Biotechnol. 2014; 32:896–902. 10.1038/nbt.2931. - DOI - PMC - PubMed
    1. Li S, Labaj PP, Zumbo P et al. Detecting and correcting systematic variation in large-scale RNA sequencing data. Nat Biotechnol. 2014; 32:888–95. 10.1038/nbt.3000. - DOI - PMC - PubMed
    1. Langfelder P, Horvath S WGCNA: an R package for weighted correlation network analysis. BMC Bioinf. 2008; 9:559. 10.1186/1471-2105-9-559. - DOI - PMC - PubMed
    1. van Dam S, Vosa U, van der Graaf A et al. Gene co-expression analysis for functional classification and gene-disease predictions. Brief Bioinform. 2018; 19:575–92. - PMC - PubMed

LinkOut - more resources