Randomized Controlled Trial
. 2025 Jun;603(11):3463-3477.
doi: 10.1113/JP288710. Epub 2025 May 31.

The impact of metformin on placental ageing in humans and mice

Affiliations
Randomized Controlled Trial

The impact of metformin on placental ageing in humans and mice

Grace J Hattersley et al. J Physiol. 2025 Jun.

Abstract

Placental ageing refers to the physiological accumulation of a senescent phenotype over a healthy pregnancy. In pregnancies affected by complications such as pre-eclampsia and fetal growth restriction, placental ageing is notably accelerated and observed at an earlier gestational age. Metformin is used during pregnancy for an increasing variety of indications, including treatment of gestational diabetes, and may have a role in slowing cellular ageing. It is therefore essential to understand the potential impact of metformin on placental ageing. Placental samples (n = 105) were obtained from women with body mass index ≥30 kg/m2 and who were randomized to treatment with metformin or placebo during pregnancy. Ageing was assessed by measuring telomere length, histological examination, and using array-based technologies to investigate gene expression and methylation. Results were validated using isolated human trophoblasts treated in vitro with metformin, and in a complementary mouse model. There were no differences between metformin-exposed and control placentas in terms of telomere length, fibrosis or calcification. There were no differences in placental gene expression or methylation patterns by metformin status. In our mouse model, no genes classically associated with cellular ageing were differentially expressed and no senescence pathway showed evidence of enrichment with metformin treatment. There was no evidence that metformin either slows or accelerates placental ageing pathways in the complementary models that we investigated. Our findings are reassuring with regard to the safety of metformin used to treat gestational diabetes, but do not support a role for metformin in the prevention of adverse pregnancy outcomes in non-diabetic women. KEY POINTS: Accelerated placental ageing, where the senescent phenotype that normally accumulates over a healthy pregnancy is observed at a premature gestational age, is associated with adverse pregnancy outcomes. Metformin has been proposed as an anti-ageing drug elsewhere. Therefore, metformin could alter the trajectory of placental ageing and prevent associated pregnancy complications. The present study incorporated human data from a randomized clinical trial and complementary models. Metformin did not impact methylation-predicted gestational age, telomere length, gene expression or histological ageing in human placentas treated in vivo, isolated trophoblasts treated in vitro or mouse models. Metformin neither decelerated nor accelerated placental ageing, thereby supporting its continued use in the obstetric setting, for instance in the treatment of gestational diabetes. Metformin cannot be recommended to prevent adverse pregnancy outcomes because we found no evidence suggesting it decelerates placental ageing. Further research is warranted to find drug therapies for this purpose.

Keywords: fetus; gestational diabetes; metformin; placenta; pregnancy; trophoblast.


Conflict of interest statement

None declared.

Figures
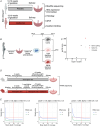
Figure 1
Figure 1. Model systems and methods
A, EMPOWaR trial. Placentas were collected at term from obese pregnancies treated with placebo or metformin and processed. B, human trophoblast model. Primary cytotrophoblasts were isolated from placentas delivered by caesarean section at term for treatment with placebo or metformin and processing for qPCR. C, beta‐hCG rise in cultured human cytotrophoblasts over time. Representative data from n = 1 placenta. The cells are treated with metformin on Day 4, as described in the Methods. D, mouse model. Obese mice were treated with metformin or placebo during their secondary pregnancy. Placentas collected at term were processed for bulk RNAseq. E, power calculations for murine bulk RNAseq. The mean coefficient of variation (CV) for the RNAseq data was 0.4, and a log2‐fold change of 1, corresponding to an effect size of 2 (blue line), was deemed significant. The horizontal red dashed line corresponds to a sample size of 12 and the vertical red dashed line corresponds to a mean depth of coverage of 50, which was exceeded in all samples. Power (1 − β) and alpha values are reported in the plot titles. [Colour figure can be viewed at wileyonlinelibrary.com]
Figure 2
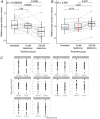
Figure 2. Correlation between predicted gestational age based on epigenetic signatures and true gestational age in metformin‐treated and control placentas (n = 103)
A, true gestational age against gestational age predicted by the RPC, CPC and refined RPC regression models in control and metformin‐treated placentas (n = 103) (RPC = robust placental clock; CPC = control placental clock; Refined_RPC = refined robust placental clock; GA = gestational age; Cor = correlation coefficient; MAE = mean absolute error). B, differences between true and predicted gestational age in metformin‐treated (n = 51) versus control (n = 52) placentas. Mean and standard deviations are shown. Pairwise comparisons were calculated using Student's t tests. [Colour figure can be viewed at wileyonlinelibrary.com]
Figure 3
Figure 3. Expression of ageing associated genes in metformin‐treated and control placentas
A and B, expression on qPCR of PPARGC1A (A) and ERBB (B) genes in isolated human trophoblasts following placebo (n = 15), 10 µm metformin (n = 15) or 100 µm (n = 15) treatment. Medians and IQR are shown. One‐way ANOVA and Mann–Whitney U test P‐values are indicated. C, expression on qPCR of 10 key ageing and oxidative stress response‐associated genes in whole human placentas treated with placebo (n = 24) or metformin (n = 24) during pregnancy. [Colour figure can be viewed at wileyonlinelibrary.com]
Figure 4
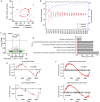
Figure 4. Gene expression in metformin‐treated mice (n = 12) compared to control obese mice (n = 12)
A, principal component (PC) analysis of RNAseq data of obese placentas. Grey = control obese mice; red = metformin‐treated obese mice. B, principal component analysis of RNAseq data of obese placentas. Right y‐axis (blue) shows the cumulative variance accounted for by each principal component. The dashed line indicates 90% cumulative variance. P‐values compare principal component loadings for untreated controls versus metformin‐treated placentas and were calculated by Mann–Whitney U test. Grey = control obese mice; red = metformin‐treated obese mice. C, volcano plot demonstrating differentially expressed genes in metformin‐treated versus control obese mice placentas. Adjusted P‐value cut‐off = 0.05. Absolute log2 fold change cut‐off = 1. LFC = log2 fold change; Padj = adjusted P‐value; NS = not significant (≥ 0.05, absolute LFC < 1). D, adjusted P‐values from gene set enrichment analysis (GSEA) of selected cellular ageing pathways obtained from the Molecular Signatures Database (MSigDB). E, GSEA of gene signatures upregulated (top) and downregulated (bottom) in senescence in metformin compared to control obese murine placentas. Gene signatures derived from Casella et al. (2019), GEO: GSE130727. F, GSEA of gene signatures upregulated (top) and downregulated (bottom) in preterm birth in metformin compared to control obese murine placentas. Gene signatures derived from Akram et al. (2022), GEO: GSE211927. [Colour figure can be viewed at wileyonlinelibrary.com]
Figure 5
Figure 5. Telomere length in the placentas of women treated with metformin (n = 24) or placebo (n = 23) during pregnancy
A, average telomere lengths by metformin treatment status. Medians and IQR are shown. B, ratio of long to short telomeres by metformin treatment status. Medians and IQR are shown. C, the percentage of short telomeres with length 1.3–2.4 kb over gestation in metformin (red) versus control obese (black) placentas. Pairwise comparisons between untreated and metformin‐treated placentas were performed using a Mann–Whitney U test. [Colour figure can be viewed at wileyonlinelibrary.com]
Figure 6
Figure 6. Placental histology in placentas from women treated with metformin (n = 24) or placebo (n = 24) during pregnancy
A, percentage placental calcification by metformin treatment status. B, percentage placental fibrin by metformin treatment status. Medians and IQR are shown. Unadjusted pairwise comparisons were performed using a Mann–Whitney U test. [Colour figure can be viewed at wileyonlinelibrary.com]

References

    1. Aiken, C. E. , Tarry‐Adkins, J. L. , Spiroski, A. M. , Nuzzo, A. M. , Ashmore, T. J. , Rolfo, A. , Sutherland, M. J. , Camm, E. J. , Giussani, D. A. , & Ozanne, S. E. (2019). Chronic gestational hypoxia accelerates ovarian aging and lowers ovarian reserve in next‐generation adult rats. Federation of American Societies for Experimental Biology Journal, 33(6), 7758–7766. - PMC - PubMed
    1. Akram, K. M. , Kulkarni, N. S. , Brook, A. , Wyles, M. D. , & Anumba, D. O. C. (2022). Transcriptomic analysis of the human placenta reveals trophoblast dysfunction and augmented wnt signalling associated with spontaneous preterm birth. Frontiers in Cell and Developmental Biology, 10, 987740. - PMC - PubMed
    1. Casella, G. , Munk, R. , Kim, K. M. , Piao, Y. , De, S. , Abdelmohsen, K. , & Gorospe, M. (2019). Transcriptome signature of cellular senescence. Nucleic Acids Research, 47(14), 7294–7305. - PMC - PubMed
    1. Catalano, P. M. , & Ehrenberg, H. M. (2006). The short‐ and long‐term implications of maternal obesity on the mother and her offspring. British Journal of Obstetrics and Gynaecology, 113(10), 1126–1133. - PubMed
    1. Catalano, P. M. , & Shankar, K. (2017). State of the Art Review: Obesity and pregnancy: Mechanisms of short term and long term adverse consequences for mother and child. The British Medical Journal, j1. 10.1136/BMJ.J1 - DOI - PMC - PubMed

Publication types