. 2025 Jul:84:103703.
doi: 10.1016/j.redox.2025.103703. Epub 2025 May 28.

Histone lactylation-induced premature senescence contributes to 1-nitropyrene-Induced chronic obstructive pulmonary disease

Affiliations

Histone lactylation-induced premature senescence contributes to 1-nitropyrene-Induced chronic obstructive pulmonary disease

Rong-Rong Wang et al. Redox Biol. 2025 Jul.

Abstract

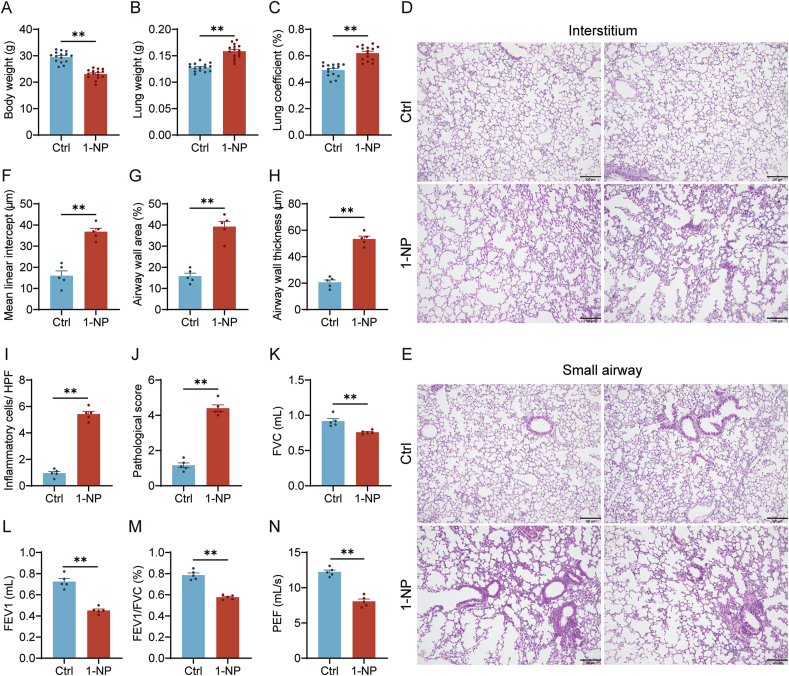
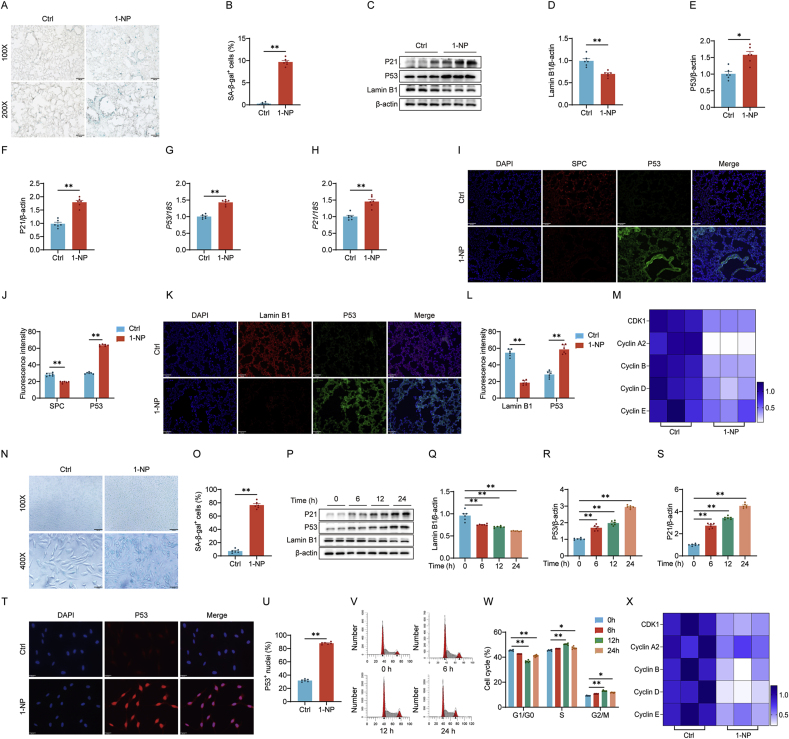
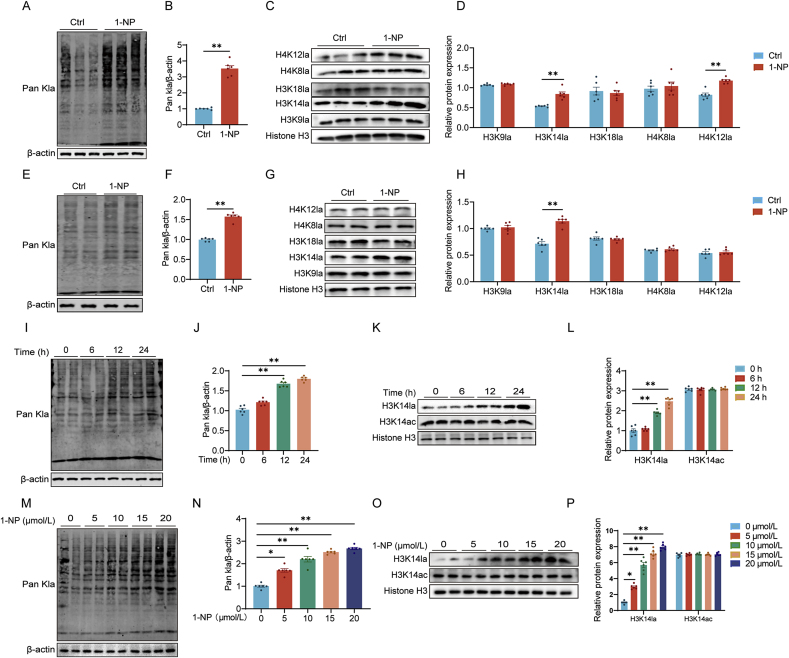
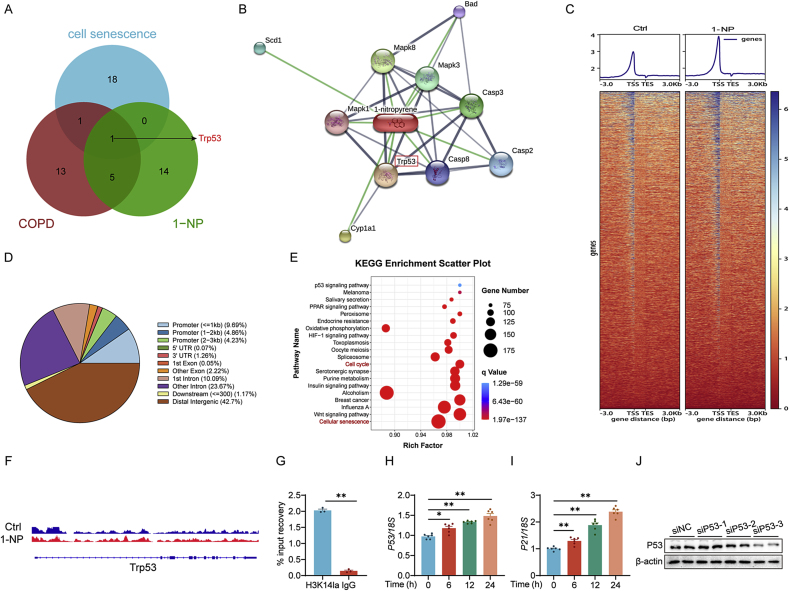
Our previous study revealed that mice exposed to 1-nitropyrene (1-NP) develop pulmonary fibrosis and senescent alveolar cells. However, the impacts of chronic 1-NP on chronic obstructive pulmonary disease (COPD) and the underlying mechanism are unclear. Our research suggested that chronic 1-NP evoked alveolar structure damage, inflammatory cell infiltration, and pulmonary function decline in mice. Moreover, 1-NP increased p53 and p21 expression, the number of β-galactosidase-positive cells, and cell cycle arrest in mouse lungs and MLE-12 cells. Moreover, 1-NP promoted glycolysis and upregulated lactic dehydrogenase A (LDHA) and lactate production in mouse lungs and MLE-12 cells. Elevated glycolysis provoked histone lactylation, but not histone acetylation in pulmonary epithelial cells. Mechanistically, histone H3 lysine 14 lactylation (H3K14la) was upregulated in pulmonary epithelial cells. P53 knockdown mitigated 1-NP-induced cell cycle arrest and senescence in MLE-12 cells. CUT&Tag and ChIP-qPCR experiments confirmed that increased H3K14la directly upregulated p53 transcription in pulmonary epithelial cells. As expected, LDHA knockdown alleviated 1-NP-triggered cell cycle arrest and senescence in MLE-12 cells. In addition, supplementation with oxamate, an inhibitor of LDH, attenuated 1-NP-incurred premature senescence and the COPD-like phenotype in mice. These data revealed for the first time that histone lactylation-induced the increase in p53 transcription contributes to pulmonary epithelial cell senescence during 1-NP-induced COPD progression. Our results provide a basis for repressing lactate production as a promising therapeutic strategy for COPD.

Keywords: 1-Nitropyrene; COPD; Cellular senescence; Histone lactylation; P53.


Conflict of interest statement

Declaration of competing interest The authors declare that they have no known competing financial interests or personal relationships that could have appeared to influence the work reported in this paper.

Figures

Image 1
Graphical abstract
Fig. 1
Fig. 1
1-NP exposure caused a COPD-like phenotype in mice. (A-N) All the mice were exposed to 1-NP aerosol (200 mg/L, 4 h/day, once every 2 days) or DMSO through the respiratory tract for 4 months. All the mice were harvested, and pulmonary function was detected. (A) Body weight. (B) Lung weight. (C) Lung coefficient. (D, E) Lung sections were stained with hematoxylin and eosin. Original magnification: 100 × . (D) Pulmonary interstitium. (E) Pulmonary small airway. (F) Mean linear intercept. (G) Airway wall area. (H) Airway wall thickness. (I) Inflammatory cells. (J) Pathological scores. (K-N) Pulmonary function was measured. (K) FVC. (L) FEV1. (M) FEV1/FVC. (N) PEF. All the data were expressed as the means ± S.E.M. (N=5). ∗P < 0.05, ∗∗P < 0.01.
Fig. 2
Fig. 2
1-NP exposure induced cell cycle arrest and premature senescence in mouse lungs and MLE-12 cells. (A-K) All the mice were exposed to 1-NP aerosol (200 mg/L, 4 h/day, once every 2 days) or DMSO through the respiratory tract for 4 months. All the mice were harvested, and cell cycle arrest and cellular senescence were evaluated. (A) Lung sections were stained with SA-β-gal. Original magnification: 100 × and 200 × . (B) The number of SA-β-gal-positive cells was calculated. (C) The protein expression of cellular senescence markers was assessed via western blotting. (D-F) Quantitative analyses were conducted. (D) Lamin B1. (E) P53. (F) P21. (G-H) The mRNA levels of senescence markers were detected via RT-qPCR. (G) P53. (H) P21. (I, J) The colocalization of SPC with p53 was evaluated by IF. (I) Representative images were shown. Original magnification: 100 ×. (J) The number of colocalized cells was evaluated. (K, L) The colocalization of Lamin B1 with p53 was evaluated by IF. (K) Representative images were shown. Original magnification: 100 ×. (L) The number of colocalized cells was evaluated. (M) The mRNA levels of cyclins and cyclin-dependent kinases were detected via RT-qPCR. (N-X) MLE-12 cells were treated with 1-NP (5 μm) for different durations. Then, cell cycle arrest and senescence were evaluated. (N) SA-β-gal staining was performed in MLE-12 cells. Original magnification: 100 × and 400 × . (O) The number of SA-β-gal-positive cells was calculated. (P) The protein expression of cellular senescence markers was assessed with western blotting. (Q-S) Quantitative analyses were conducted. (Q) Lamin B1. (R) P53. (S) P21. (T) p53-positive nuclei were detected via IF. Original magnification: 630 × . (U) The number of p53-positive nuclei was assessed. (V) Cell cycle distribution was measured via flow cytometry. (W) Cell cycle distribution was analyzed. (X) Cyclin and cyclin-dependent kinases mRNA levels were detected via RT-qPCR. All the data were expressed as the means ± S.E.M. (N=6). ∗P < 0.05, ∗∗P < 0.01.
Fig. 3
Fig. 3
1-NP exposure incurred glycolysis and lactate production in mouse lungs and MLE-12 cells. (A-F) All the mice were exposed to 1-NP aerosol (200 mg/L, 4 h/day, once every 2 days) or DMSO through the respiratory tract for 4 months. All the mice were harvested, and the protein expression of glycolysis-related genes in mouse lungs was assessed via western blotting. (A) Representative bands were shown. (B-F) Quantitative analyses were conducted. (B) HK2. (C) PFKFB3. (D) PKM2. (E) LDHA. (F) LDHB. (G-L) MLE-12 cells were treated with 1-NP (5 μm) for different durations. The expression levels of glycolytic enzymes were subsequently measured. (G) Representative bands were shown. (H-L) Quantitative analyses were conducted. (H) HK2. (I) PFKFB3. (J) PKM2. (K) LDHA. (L) LDHB. (M − O) The key enzyme involved in the conversion of pyruvate to acetyl-CoA and its inhibitor were assessed via western blotting. (M) Representative bands were shown. (N, O) Quantitative analyses were conducted. (N) PDH. (O) PDK1. (P-S) Lactate levels were detected. (P) Serum lactate. (Q) Pulmonary lactate. (R) Supernatant lactate. (S) Intracellular lactate. (T) The content of intracellular acetyl-CoA was measured in MLE-12 cells. (U) Schematic of glycolysis. All the data were expressed as the means ± S.E.M. (N=6). ∗P < 0.05, ∗∗P < 0.01.
Fig. 4
Fig. 4
1-NP exposure promoted histone lactylation in mouse lungs and MLE-12 cells. (A-D) All the mice were exposed to 1-NP aerosol (200 mg/L, 4 h/day, once every 2 days) or DMSO through the respiratory tract for 4 months. All the mice were harvested and histone lactylation in mouse lungs was evaluated. (A) Pan Kla levels were measured via western blotting. (B) Quantitative analysis was conducted. (C) Different histone lactylation levels were determined by western blotting. (D) Quantitative analyses were performed. (E-H) MLE-12 cells were treated with 1-NP (5 μm) for 24 h. (E) Pan Kla was detected via western blotting. (F) Quantitative analysis was performed. (G) The levels of different types of histones lactylation were evaluated via western blotting. (H) Quantitative analyses were performed. (I-L) The effects of 1-NP exposure (5 μm) on histone lactylation and acetylation were explored in MLE-12 cells at 0 h, 6 h, 12 h, and 24 h. (I) Pan Kla was detected via western blotting. (J) Quantitative analysis was performed. (K) H3K14la and H3K14ac expression was determined via western blotting. (L) Quantitative analyses were performed. (M − P) Effects of 1-NP exposure at different concentrations (0 μmol/L, 5 μmol/L, 10 μmol/L, 15 μmol/L, and 20 μmol/L) on histone lactylation and acetylation were analyzed in MLE-12 cells after 24 h. (M) Pan Kla expression was determined via western blotting. (N) Quantitative analysis was performed. (O) H3K14la and H3K14ac protein expressions levels were evaluated via western blotting. (P) Quantitative analyses were performed. All the data were expressed as the means ± S.E.M. (N=6). ∗P < 0.05, ∗∗P < 0.01.
Fig. 5
Fig. 5
LDHA knockdown alleviated histone lactylation, cell cycle arrest, and premature senescence in MLE-12 cells. (A) Diagrammatic sketch of lactate production. (B-J) The impact of LDHA knockdown on 1-NP-mediated histone lactylation was analyzed in MLE-12 cells. LDHA siRNAs were transfected, and then, MLE-12 cells were cocultured with 1-NP (5 μM). (B, C) LDHA protein expression was measured via western blotting. (D) The content of intracellular lactate was measured. (E) Lactate levels in the supernatant were determined. (F) Pan Kla and Pan Kac proteins expression was measured via western blotting. (G) H3K14la and H3K14ac proteins expression was measured via western blotting. (H) Quantitative analyses were performed. (I, J) H3K14la-positive nuclei were identified via IF and analyzed. Original magnification: 400 ×. (K-W) The influences of LDHA knockdown on 1-NP-evoked cell cycle arrest and premature senescence were explored in MLE-12 cells. (K) Senescent cells were evaluated by SA-β-gal staining. Original magnifications: 100 × and 400 × . (L) The number of SA-β-gal-positive cells was calculated. (M) The protein expression of cell cycle markers was detected via western blotting. (N-P) Quantitative analyses were performed. (N) Lamin B1. (O) P53. (P) P21. (Q, R) p53 and p21 mRNA levels were detected via RT-qPCR. (Q) P53. (R) P21. (S) P53-positive nuclei were tested by IF. Original magnification: 400 ×. (T) The number of p53-positive nuclei was calculated. (U) The cell cycle distribution was determined by flow cytometry. (V) Cell cycle distribution was analyzed. (W) The mRNA levels of SASP genes were detected by RT-qPCR. All the data were expressed as means ± S.E.M. (N=6). ∗P < 0.05, ∗∗P < 0.01.
Fig. 5
Fig. 5
LDHA knockdown alleviated histone lactylation, cell cycle arrest, and premature senescence in MLE-12 cells. (A) Diagrammatic sketch of lactate production. (B-J) The impact of LDHA knockdown on 1-NP-mediated histone lactylation was analyzed in MLE-12 cells. LDHA siRNAs were transfected, and then, MLE-12 cells were cocultured with 1-NP (5 μM). (B, C) LDHA protein expression was measured via western blotting. (D) The content of intracellular lactate was measured. (E) Lactate levels in the supernatant were determined. (F) Pan Kla and Pan Kac proteins expression was measured via western blotting. (G) H3K14la and H3K14ac proteins expression was measured via western blotting. (H) Quantitative analyses were performed. (I, J) H3K14la-positive nuclei were identified via IF and analyzed. Original magnification: 400 ×. (K-W) The influences of LDHA knockdown on 1-NP-evoked cell cycle arrest and premature senescence were explored in MLE-12 cells. (K) Senescent cells were evaluated by SA-β-gal staining. Original magnifications: 100 × and 400 × . (L) The number of SA-β-gal-positive cells was calculated. (M) The protein expression of cell cycle markers was detected via western blotting. (N-P) Quantitative analyses were performed. (N) Lamin B1. (O) P53. (P) P21. (Q, R) p53 and p21 mRNA levels were detected via RT-qPCR. (Q) P53. (R) P21. (S) P53-positive nuclei were tested by IF. Original magnification: 400 ×. (T) The number of p53-positive nuclei was calculated. (U) The cell cycle distribution was determined by flow cytometry. (V) Cell cycle distribution was analyzed. (W) The mRNA levels of SASP genes were detected by RT-qPCR. All the data were expressed as means ± S.E.M. (N=6). ∗P < 0.05, ∗∗P < 0.01.
Fig. 6
Fig. 6
Histone lactylation activated p53 transcription in pulmonary epithelial cells. (A) 1-NP-affected genes, COPD-related genes, and senescence-associated genes were analyzed via a Venn diagram. (B) The proteins affected by 1-NP exposure were predicted. (C) The heatmap revealed the binding density of H3K14la, among which existed distinct binding peaks of H3K14la in the 1-NP group and the control group, sorted by signal intensity. (D) A pie chart showed the genomic distribution of H3K14la peaks in the 1-NP group. (E) The bubble plot revealed the KEGG analysis of the increased binding peak of H3K14la in the 1-NP group. (F) IGV tracked for Trp53-enriched in the genomic positions. (G) ChIP-qPCR was used to analyze the binding efficiency of H3K14la to the p53 promoter region. (H, I) The levels of mRNAs associated with cell cycle arrest were detected via RT-qPCR. (H) P53. (I) P21. (J-N) The impact of p53 knockdown on 1-NP-evoked cell cycle arrest was evaluated in MLE-12 cells. (J, K) The effect of p53 siRNA on p53 protein expression was assessed. (L, M) P21 protein expression was determined by western blotting and quantified. (N) P21 mRNA expression was evaluated by RT-qPCR. (O, P) The effect of p53 siRNA on 1-NP-induced cell cycle arrest was explored. (O) Cell cycle distribution was determined by flow cytometry. (P) Cell cycles distribution was analyzed. (Q-R) The effect of p53 knockdown on 1-NP-triggered premature senescence was estimated in MLE-12 cells. (Q) Senescent cells were detected via SA-β-gal staining. Original magnifications: 100 × and 400 × . (R) The number of SA-β-gal-positive cells was calculated. (S-W) The mRNA levels of SASP components were measured via RT-qPCR. (S) Il-1β. (T) Il-6. (U) Tnf-α. (V) Mmp-2. (W) Cxcl-9. All the data were expressed as the means ± S.E.M. (N=6). ∗P < 0.05, ∗∗P < 0.01.
Fig. 6
Fig. 6
Histone lactylation activated p53 transcription in pulmonary epithelial cells. (A) 1-NP-affected genes, COPD-related genes, and senescence-associated genes were analyzed via a Venn diagram. (B) The proteins affected by 1-NP exposure were predicted. (C) The heatmap revealed the binding density of H3K14la, among which existed distinct binding peaks of H3K14la in the 1-NP group and the control group, sorted by signal intensity. (D) A pie chart showed the genomic distribution of H3K14la peaks in the 1-NP group. (E) The bubble plot revealed the KEGG analysis of the increased binding peak of H3K14la in the 1-NP group. (F) IGV tracked for Trp53-enriched in the genomic positions. (G) ChIP-qPCR was used to analyze the binding efficiency of H3K14la to the p53 promoter region. (H, I) The levels of mRNAs associated with cell cycle arrest were detected via RT-qPCR. (H) P53. (I) P21. (J-N) The impact of p53 knockdown on 1-NP-evoked cell cycle arrest was evaluated in MLE-12 cells. (J, K) The effect of p53 siRNA on p53 protein expression was assessed. (L, M) P21 protein expression was determined by western blotting and quantified. (N) P21 mRNA expression was evaluated by RT-qPCR. (O, P) The effect of p53 siRNA on 1-NP-induced cell cycle arrest was explored. (O) Cell cycle distribution was determined by flow cytometry. (P) Cell cycles distribution was analyzed. (Q-R) The effect of p53 knockdown on 1-NP-triggered premature senescence was estimated in MLE-12 cells. (Q) Senescent cells were detected via SA-β-gal staining. Original magnifications: 100 × and 400 × . (R) The number of SA-β-gal-positive cells was calculated. (S-W) The mRNA levels of SASP components were measured via RT-qPCR. (S) Il-1β. (T) Il-6. (U) Tnf-α. (V) Mmp-2. (W) Cxcl-9. All the data were expressed as the means ± S.E.M. (N=6). ∗P < 0.05, ∗∗P < 0.01.
Fig. 7
Fig. 7
OXA supplementation alleviated 1-NP-triggered cell cycle arrest and cellular senescence in mouse lungs. (A-H) The effect of OXA supplementation on 1-NP-mediated histone lactylation was analyzed in mice. In the OXA and 1-NP + OXA groups, the mice were pretreated with OXA (100 mg/kg) through intraperitoneal injection. In the 1-NP and 1-NP + OXA groups, the mice were exposed to 1-NP aerosol (200 mg/L, 4 h/day, once every 2 days). Four months after 1-NP exposure, all the mice were harvested, and histone lactylation was measured in the lungs. (A) Serum lactate level was measured. (B) Pulmonary lactate level was quantified. (C, D) Pan Kla protein expression was detected via western blotting and quantified. (E, F) H3K14la protein expression was detected via western blotting and quantified. (G, H) The number of H3K14la-positive nuclei was assessed via IHC and analyzed. Original magnification: 100 × and 400 × . (I-S) The influences of OXA supplementation on 1-NP-induced cell cycle arrest and premature senescence were explored in mouse lungs. (I, K) Senescent cells were evaluated by SA-β-gal staining and the number of SA-β-gal-positive cells was calculated. Original magnifications: 100 × and 400 × . (J, L) The number of p53-positive nuclei was measured via IHC and calculated. Original magnification: 100 × and 400 × . (M) The protein expression of cell cycle markers was assessed by western blotting. (N-P) Quantitative analysis was performed. (N) Lamin B1. (O) P53. (P) P21. (Q, R) The mRNA levels of cell cycle markers were detected via RT-qPCR. (Q) P53. (R) P21. (S, T) The number of p21-positive cells was detected via IF and calculated. Original magnification: 630 × . (U) The mRNA levels of SASP factors were detected by RT-qPCR. All the data were expressed as the means ± S.E.M. (N=6). ∗P < 0.05, ∗∗P < 0.01.
Fig. 7
Fig. 7
OXA supplementation alleviated 1-NP-triggered cell cycle arrest and cellular senescence in mouse lungs. (A-H) The effect of OXA supplementation on 1-NP-mediated histone lactylation was analyzed in mice. In the OXA and 1-NP + OXA groups, the mice were pretreated with OXA (100 mg/kg) through intraperitoneal injection. In the 1-NP and 1-NP + OXA groups, the mice were exposed to 1-NP aerosol (200 mg/L, 4 h/day, once every 2 days). Four months after 1-NP exposure, all the mice were harvested, and histone lactylation was measured in the lungs. (A) Serum lactate level was measured. (B) Pulmonary lactate level was quantified. (C, D) Pan Kla protein expression was detected via western blotting and quantified. (E, F) H3K14la protein expression was detected via western blotting and quantified. (G, H) The number of H3K14la-positive nuclei was assessed via IHC and analyzed. Original magnification: 100 × and 400 × . (I-S) The influences of OXA supplementation on 1-NP-induced cell cycle arrest and premature senescence were explored in mouse lungs. (I, K) Senescent cells were evaluated by SA-β-gal staining and the number of SA-β-gal-positive cells was calculated. Original magnifications: 100 × and 400 × . (J, L) The number of p53-positive nuclei was measured via IHC and calculated. Original magnification: 100 × and 400 × . (M) The protein expression of cell cycle markers was assessed by western blotting. (N-P) Quantitative analysis was performed. (N) Lamin B1. (O) P53. (P) P21. (Q, R) The mRNA levels of cell cycle markers were detected via RT-qPCR. (Q) P53. (R) P21. (S, T) The number of p21-positive cells was detected via IF and calculated. Original magnification: 630 × . (U) The mRNA levels of SASP factors were detected by RT-qPCR. All the data were expressed as the means ± S.E.M. (N=6). ∗P < 0.05, ∗∗P < 0.01.
Fig. 8
Fig. 8
OXA supplementation attenuated 1-NP-evoked a COPD-like phenotype in mice. (A-N) The effect of OXA supplementation on 1-NP-induced COPD was analyzed in mice. In the OXA and 1-NP + OXA groups, the mice were supplemented with OXA (100 mg/kg) through intraperitoneal injection. In the 1-NP and 1-NP + OXA groups, the mice were exposed to 1-NP aerosol (200 mg/L, 4 h/day, once every 2 days). Four months after 1-NP exposure, all the mice were harvested, pulmonary function was tested and lung tissues were collected. (A) Body weight. (B) Lung weight. (C) Lung coefficient. (D-E) The lung interstitium and small airways were stained with hematoxylin and eosin. Original magnification: 400 × . (F) Mean linear intercept. (G) Airway wall area. (H) Airway wall thickness. (I) Inflammatory cells. (J) Pathological scores. (K-N) Pulmonary function was measured. (K) FVC. (L) FEV1. (M) FEV1/FVC. (N) PEF. All the data were expressed as the means ± S.E.M. (N=6). ∗P < 0.05, ∗∗P < 0.01.

References

    1. Bandowe B., Meusel H. Nitrated polycyclic aromatic hydrocarbons (nitro-PAHs) in the environment - a review. Sci. Total Environ. 2017;581–582:237–257. - PubMed
    1. Gao Y., Yang L., Chen J., Li Y., Jiang P., Zhang J., et al. Nitro and oxy-PAHs bounded in PM2.5 and PM1.0 under different weather conditions at Mount Tai in Eastern China: sources, long-distance transport, and cancer risk assessment. Sci. Total Environ. 2018;622–623:1400–1407. - PubMed
    1. Deng K., Chan W. Development of a QuEChERS-based method for determination of carcinogenic 2-nitrofluorene and 1-nitropyrene in rice grains and vegetables: a comparative study with benzo[a]pyrene. J. Agric. Food Chem. 2017;65(9):1992–1999. - PubMed
    1. Feng S.J., Shen X.B., Hao X.W., Cao X.Y., Li X., Yao X.L., et al. Polycyclic and nitro-polycyclic aromatic hydrocarbon pollution characteristics and carcinogenic risk assessment of indoor kitchen air during cooking periods in rural households in North China. Environ. Sci. Pollut. Res. Int. 2021;28(9):11498–11508. - PubMed
    1. Wang Y., Adgent M., Su P.H., Chen H.Y., Chen P.C., Hsiung C.A., et al. Prenatal exposure to perfluorocarboxylic acids (PFCAs) and fetal and postnatal growth in the taiwan maternal and infant cohort study. Environ. Health Perspect. 2016;124(11):1794–1800. - PMC - PubMed