. 2025 Aug;104(8):105329.
doi: 10.1016/j.psj.2025.105329. Epub 2025 May 22.

Transcriptomic analysis of the liver, jejunum, and uterus in different production stages of laying hens

Affiliations

Transcriptomic analysis of the liver, jejunum, and uterus in different production stages of laying hens

Gi Ppeum Han et al. Poult Sci. 2025 Aug.

Abstract

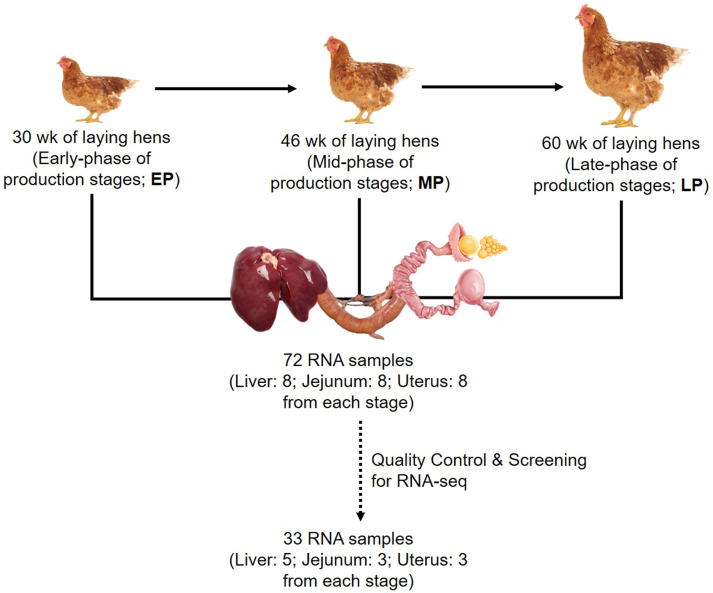
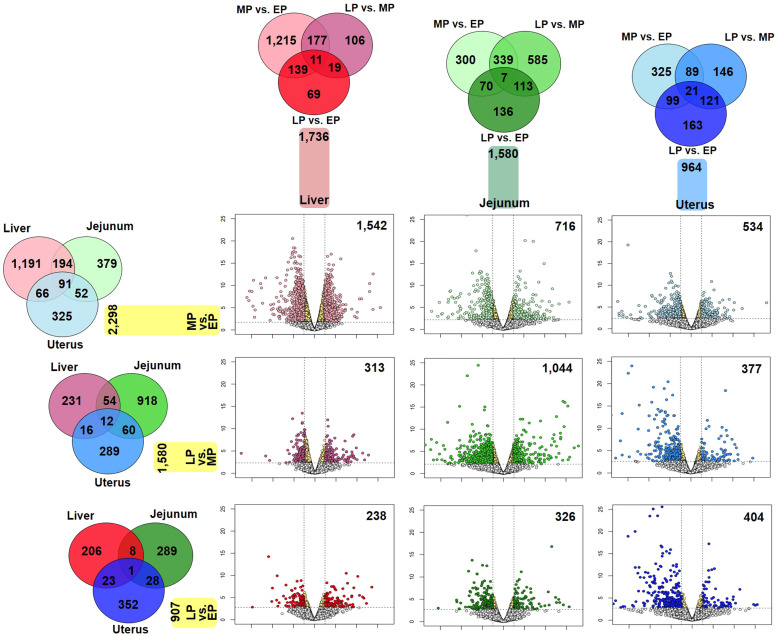
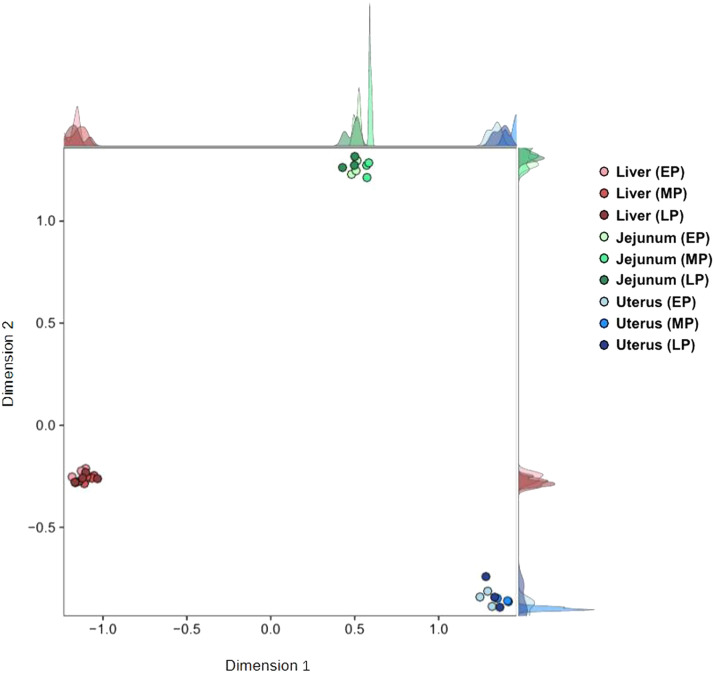
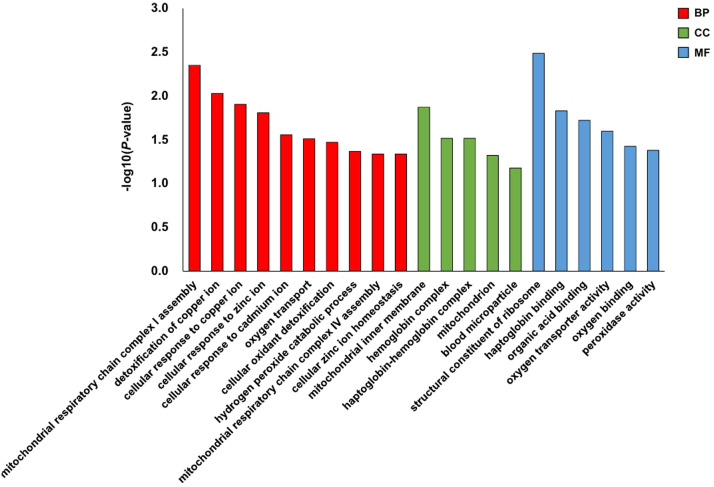
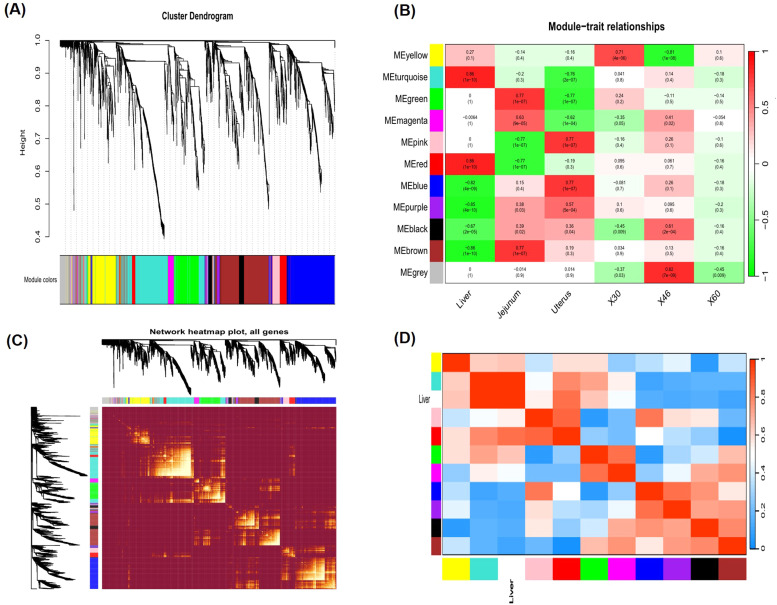
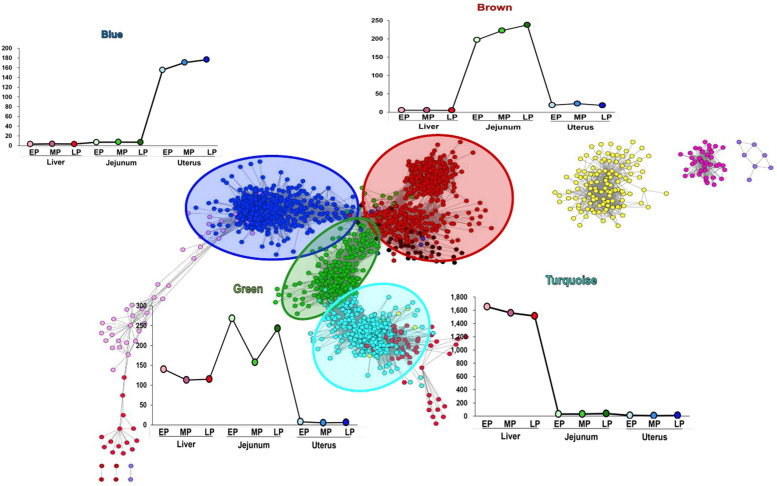
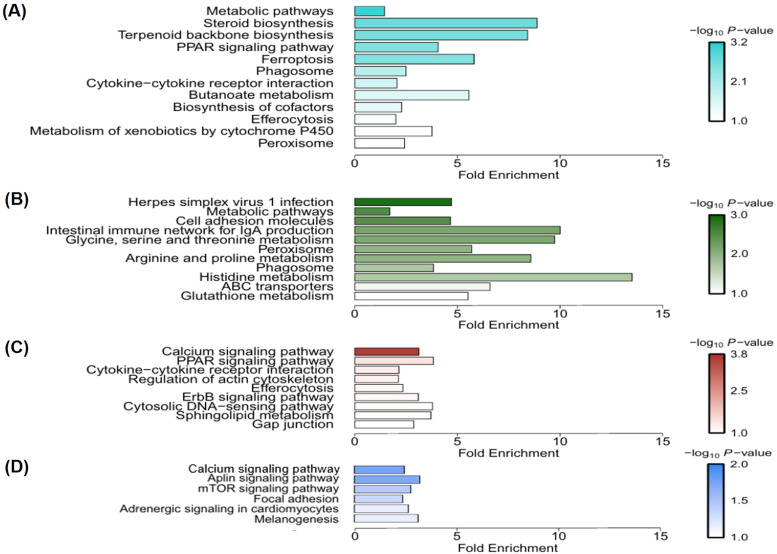
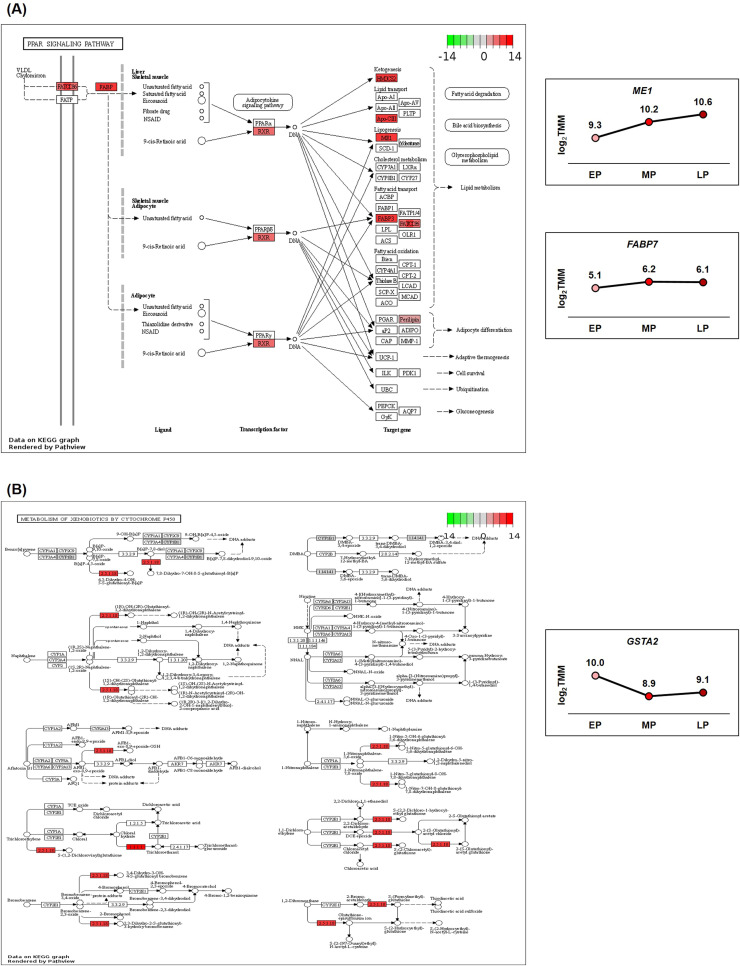
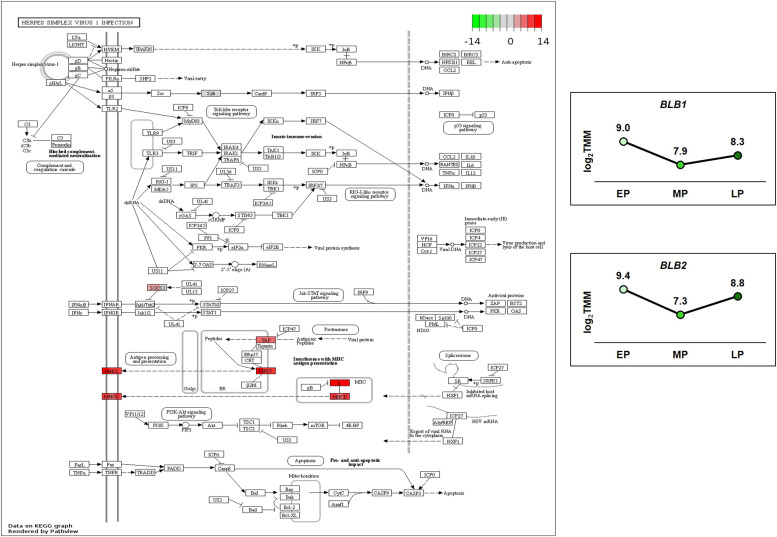
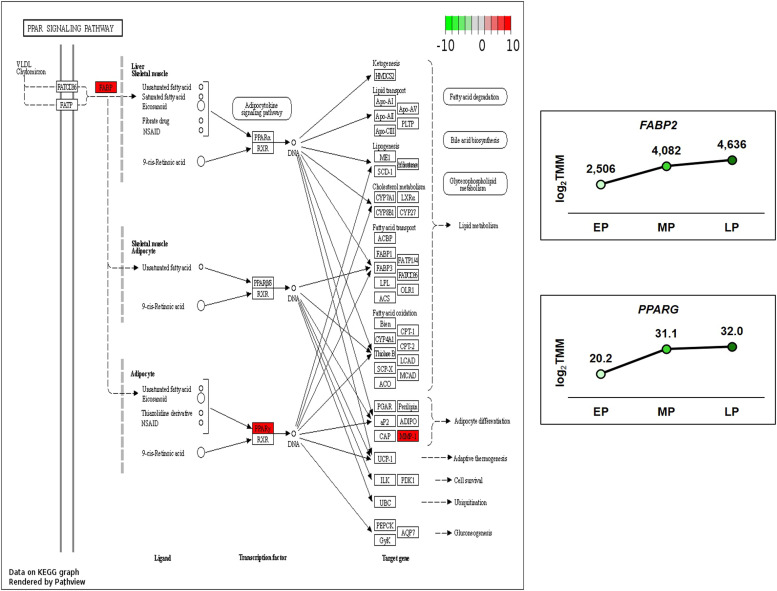
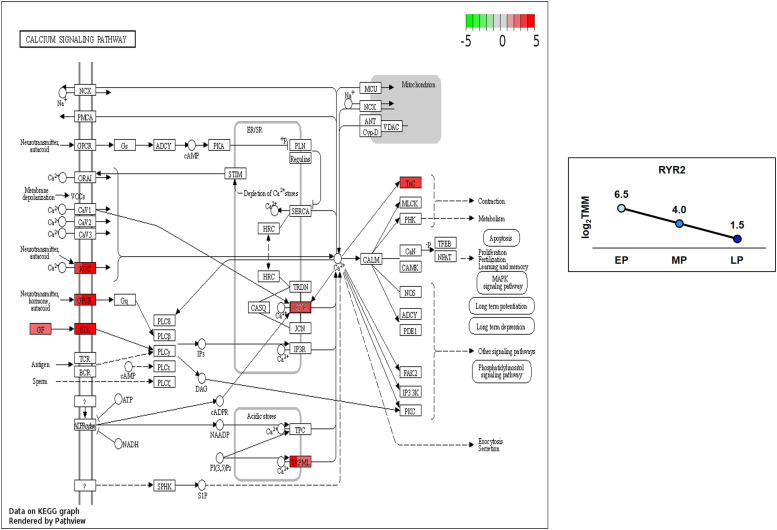
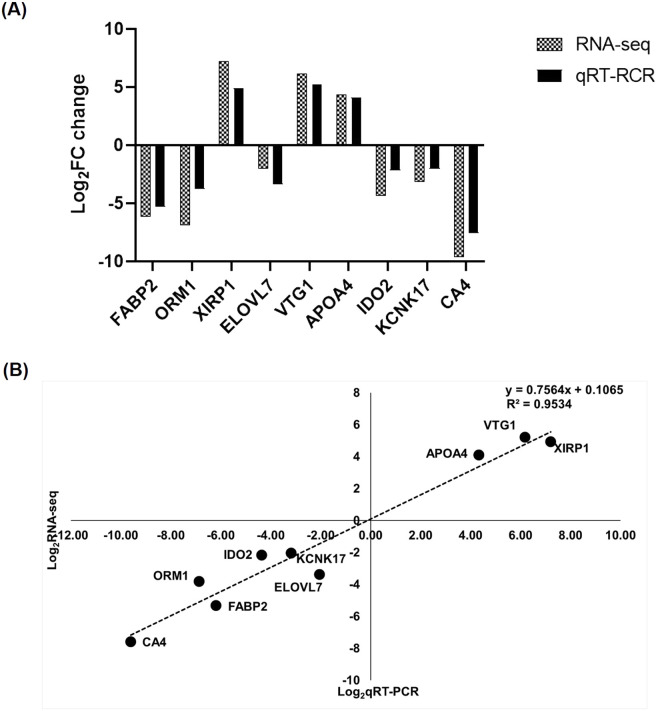
Egg production in laying hens is related to very complex and elaborate processes involving the cooperation of various tissues. Laying hens undergo this complicated production process in different production stages during overall laying periods. However, many previous studies have focused on a single tissue or specific production stage. Thus, we compared multi-tissue transcriptome profiles across different production stages using RNA-seq to understand which overall metabolic changes occur in laying hens as the stage progresses. Laying hens at three distinct production stages of early-phase (EP, 30 wk of age), mid-phase (MP, 46 wk of age), and late-phase (LP, 60 wk of age) were used to analyze transcriptomic changes for the liver, jejunum, and uterus tissues. Weighted gene co-expression network analysis was adopted to detect core modules and central genes, and finally identified 11 co-expression modules. In the liver and jejunum, the expression of genes (e.g., FABP2, FABP7, PPARG) related to fatty acid synthesis was increased with production stages. However, the expression of genes (e.g., GSTA2, BLB1 and BLB2) related to immune responses, including xenobiotic metabolism pathway and the herpes simplex virus 1 infection pathway, was increased in EP compared with other stages. Moreover, the expression of genes related to calcium signaling pathways (e.g., CACNA2D1) and muscle contraction metabolism (e.g., ACTG2 and RYR2) in the uterus was decreased as laying hens were aged. The current findings pave the way for future investigations into the physiological changes in laying hens across different production stages. This research also provides a foundation for elucidating the multi-tissue transcriptome in laying hens and identifying potential genes regulating various biological processes during overall laying periods.

Keywords: Gene co-expression network; Laying hen; Laying stage; Multi-tissue; Transcriptome.


Conflict of interest statement

Declaration of competing interest The authors declare no conflict of interest for the data presented in this experiment.

Figures

Fig 1
Fig. 1
The experimental design for RNA-sequencing (RNA-Seq) study. Three different productive stages (early, mid, and late-phase) were used for RNA-seq. Eight hens from each stage were selected to collect the liver, jejunal mucosa, and uterus tissues for RNA-Seq. Finally, 33 (3 different productive stages × 3 tissues; 5 liver, 3 jejunum, and 3 uterus) out of the 72 (3 different productive stages × 3 tissues; 8 liver, 8 jejunum, and 8 uterus) RNAs were subjected to RNA-seq.
Fig 2
Fig. 2
Transcriptomes in different tissues and different productive stage of laying hens. Dynamic view according to productive stage in laying hens. The x and y axes of the volcano plots show the log2 FCs and −log10 P values, respectively. Data information: significant DEGs (FDR < 0.05 and absolute log2 FC 1) are represented in the volcano plots, with 3 different colors (red, green, and blue) corresponding to each tissue, and the numbers of DEGs are written in the top right corner of each plot. Volcano plots and Venn diagrams for different time points are indicated with color gradients. Tissue-specific Venn diagrams are illustrated with a color gradient, based on overlapping numbers of DEGs at different production stages. Venn diagrams with scale bars show the numbers of integrated DEGs observed at each stage for each tissue.
Fig 3
Fig. 3
The multidimensional scaling (MDS) plot showing the expression level of genes in 33 different samples (3 tissues based on the transcriptomes at 3 different production stages). Red spot represents liver tissue, green spot represents jejunum tissue, and blue spot represents uterus tissue. As age increases, there was a darker appearance noted in the color of the spots.
Fig 4
Fig. 4
Most significantly enriched gene ontology (GO) terms associated with 91 differentially expressed genes between the intersection of MP vs. EP of the liver, jejunum, and uterus in laying hens. GO categories, including biological processes (BP), cellular components (CC), and molecular functions (MF), are shown in red, green, and blue color, respectively.
Fig 5
Fig. 5
The result of weighted gene co-expression network analysis. (A) Hierarchical clustering diagram. Different colors on abscissa represent different clustering modules. (B) Correlation between modules and groups. The abscissa represents tissues with different productive stage groups, and ordinate represents different module. (C) Visualized network heat map. (D) Correlation diagrams between modules. The redder the color of the area of different modules, the stronger the correlation.
Fig 6
Fig. 6
Weighted gene co-expression network analysis focusing on the important modules (Blue, Brown, Green, and Turquoise). The x and y axes of the graph show according to the different production stage and tissue group, and trimmed mean of M-value (TMM), respectively. The genes in the blue modules are specific expressed in the uterus of laying hens. The genes in the brown and green modules are specific expressed in the jejunum of laying hens. The genes in the turquoise modules are specific expressed in the liver of laying hens.
Fig 7
Fig. 7
Enrichment analyses based on the DAVID database according to different production stages of laying hens. KEGG-enriched pathways for each specific network were visualized by bar plot generations. Significantly enriched pathways represented in the plots met the following cut-of criterion: −log10P-value>1.0. (A) Turquoise module. (B) Green module. (C) Brown module. (D) Blue module.
Fig 8
Fig. 8
Gene modulations of the turquoise modules in the liver at the different production stages of laying hens. (A) ‘PPAR signaling pathway’ (B) ‘Metabolism of xenobiotics by cytochrome p450’ pathway. The x and y axes of the graph show the different production stage and log2 trimmed mean of M-value (TMM), respectively. Abbreviation: early-phase (EP, 30-wk-old), mid-phase (MP, 46-wk-old), and late-phase (LP, 60-wk-old) of production stages in laying hens.
Fig 9
Fig. 9
Gene modulations in ‘Herpes simplex virus 1 infection’ pathway of the green modules in the jejunum at the different production stages of laying hens. The x and y axes of the graph show the different production stage and log2 trimmed mean of M-value (TMM), respectively. Abbreviation: early-phase (EP, 30-wk-old), mid-phase (MP, 46-wk-old), and late-phase (LP, 60-wk-old) of production stages in laying hens.
Fig 10
Fig. 10
Gene modulations in ‘PPAR signaling pathway’ of the brown modules in the jejunum at the different production stages of laying hens. The x and y axes of the graph show the different production stage and log2 trimmed mean of M-value (TMM), respectively. Abbreviation: early-phase (EP, 30-wk-old), mid-phase (MP, 46-wk-old), and late-phase (LP, 60-wk-old) of production stages in laying hens.
Fig 11
Fig. 11
Gene modulations in ‘Calcium signaling pathway’ of the blue modules in the uterus at the different production stages of laying hens. The x and y axes of the graph show the different production stage and log2 trimmed mean of M-value (TMM), respectively. Abbreviation: early-phase (EP, 30-wk-old), mid-phase (MP, 46-wk-old), and late-phase (LP, 60-wk-old) of production stages in laying hens.
Fig 12
Fig. 12
Illustrating of quantitative reverse-transcription polymerase chain reaction (qRT-PCR) validation for selected differentially expressed genes. The selected genes were placed in x and y axes represents log2 (fold change) from qRT-PCR and RNA-sequencing. (A) comparison of the mRNA expression levels. (B) linear regression between qRT-PCR and RNA-sequencing.

Similar articles

References

    1. Adams K.A., Davis A.J. Dietary protein concentration regulates the mRNA expression of chicken hepatic malic enzyme. J. Nutr. 2001;131:2269–2274. - PubMed
    1. Andrews S. 2010. FastQC: a quality control tool for high throughput sequence data. http://www.bioinformatics.babraham.ac.uk/projects/fastqc.
    1. Anzenbacher P., Anzenbacherová E. Cytochromes P450 and metabolism of xenobiotics. Cell. Mol. Life Sci. 2001;58:737–747. - PMC - PubMed
    1. Baltaci A.K., Yuce K., Mogulkoc R. Zinc metabolism and metallothioneins. Biol. Trace Elem. Res. 2018;183:22–31. - PubMed
    1. Barzegar S., Swick R.A., Kheravii S.K., Choct M., Wu S.B. Peroxisome proliferator-activated receptor gamma upregulation and dietary fat levels in laying hens. Poult. Sci. 2021;100 - PMC - PubMed