. 2025 Jun 17;6(6):102153.
doi: 10.1016/j.xcrm.2025.102153. Epub 2025 May 30.

Cross-organ hierarchy of HLA molecular mismatches in donor-specific antibody development in solid organ transplantations

Affiliations

Cross-organ hierarchy of HLA molecular mismatches in donor-specific antibody development in solid organ transplantations

Masaaki Hirata et al. Cell Rep Med. .

Abstract

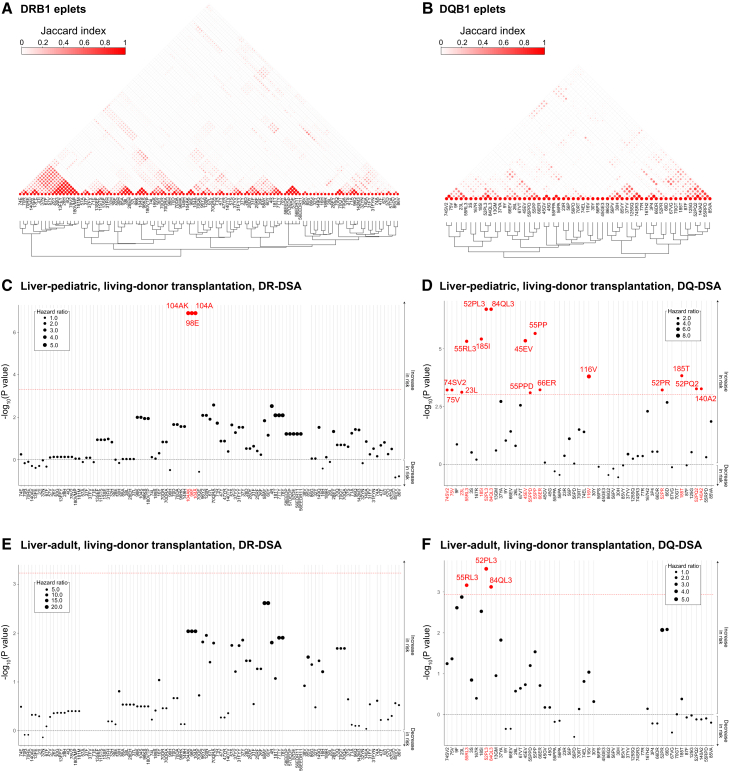
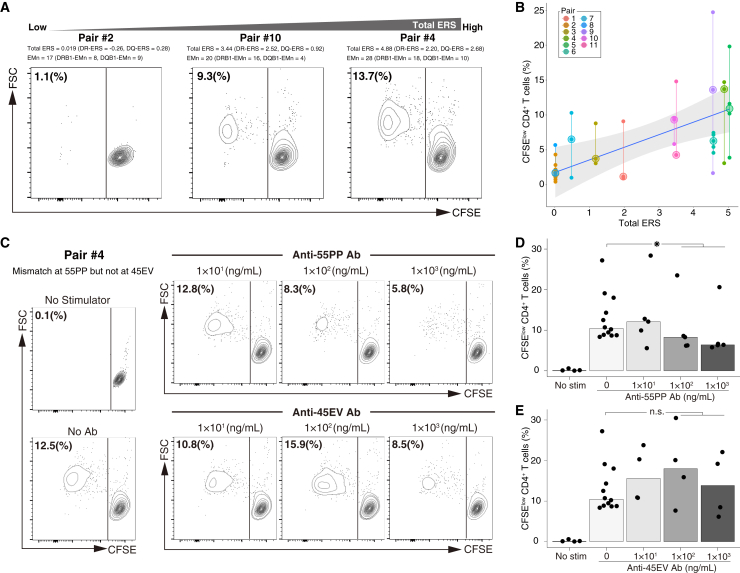
Donor-specific antibodies (DSAs) against human leukocyte antigen (HLA) play a crucial role in antibody-mediated rejection, a major barrier to successful organ transplantation. Donor-recipient HLA molecular incompatibility critically influences DSA susceptibility, commonly assessed by analyzing mismatches in the HLA eplet repertoire. This study, including six distinct liver, lung, and kidney transplant cohorts from two centers (978 donor-recipient pairs), explores associations between individual eplet mismatches and DSA development. Certain mismatched eplets are strongly linked to DSA development, while others show weaker associations, a trend consistent across different organ types. Machine learning leverages these hierarchical associations to develop an eplet risk score (ERS), outperforming traditional eplet mismatch assessments. Furthermore, T cell proliferation in mixed lymphocyte reaction in vitro correlates with the ERS, attenuated by antibody-mediated inhibition of a mismatched DSA-associated eplet. These results establish the differential immunological impacts of mismatched HLA eplets as integral in clinical practice and therapeutic innovation.

Keywords: DSA; HLA molecular mismatch; antibody-mediated rejection; eplet; risk score.


Conflict of interest statement

Declaration of interests The authors declare no competing interests.

Figures

None
Graphical abstract
Figure 1
Figure 1
Study overview The study is structured around three primary steps. Step 1 aims to identify the hierarchy of eplet mismatches within cohorts and to evaluate its reproducibility across different cohorts. Step 2 is dedicated to the development and validation of the eplet risk score (ERS). Step 3 involves experimentally validating the ERS and examining the immunogenicity of eplet mismatches identified through clinical analysis as potential drivers of donor-specific antibody risk. HLA, human leukocyte antigen; PBMC, peripheral blood mononuclear cell; CFSE, carboxyfluorescein diacetate succinimidyl ester. The figure was created with BioRender.com.
Figure 2
Figure 2
Intricate relationships among eplet mismatches and their association with donor-specific antibody development in liver transplants We clustered 105 HLA-DRB1 and 55 HLA-DQB1 eplet mismatches using the hierarchical clustering based on the Jaccard index (JI) between each pair of mismatched eplets. Complex relatedness between mismatched eplets was visualized using dendrograms with triangular matrixes (A and B). A higher JI value, approaching 1, indicates a higher likelihood of concurrent detection of the paired mismatched eplets. Survival analysis results, assessed via the Cox proportional hazards model accounting for age and gender, are represented in Manhattan-style plots (C–F). Eplets without associated dots were never identified as mismatched in patients who developed DSA in the respective cohorts. The graph has been inverted around the y = 0 horizontal line, so eplet mismatches linked to a lower risk of DSA development (i.e., hazard ratio [HR] < 1) are depicted below the y = 0 horizontal line. The red dotted line indicates the threshold for statistical significance in each cohort, and eplets reaching statistical significance are highlighted in red. Eplets with a high JI generally exhibited similar p values (y axis) and age-gender adjusted HR (indicated by dot size). Donor-recipient pairs, n = 173 (pediatric living-donor liver transplant cohort) and 159 (adult living-donor liver transplant cohort). p values were derived using the Wald test, calculated by dividing the β coefficient by its standard error.
Figure 3
Figure 3
Association between individual eplet mismatches and donor-specific antibody development in lung and kidney transplants The results of survival analysis, evaluated using the Cox proportional hazards model adjusting for age and gender, are displayed in Manhattan-style plots (A–F), as described in the legend for Figure 2. Eplets that exhibited a high Jaccard index (JI) typically presented similar p values (as shown on the y axis) and hazard ratios (HRs) adjusted for age and gender (as indicated by the size of the dots). p values were calculated using the Wald test, dividing the β coefficient by its standard error. Donor-recipient pairs, n = 182 (living-donor lung transplant cohort), 151 (deceased-donor lung transplant cohort), and 266 (kidney transplant cohort from Akita University Hospital). p values were derived using the Wald test, calculated by dividing the β coefficient by its standard error.
Figure 4
Figure 4
Overall consistency in the hierarchy of eplet mismatches across five cohorts of liver, lung, and kidney transplants Eplet mismatches significantly associated with donor-specific antibody (DSA) development were not always concordant across the different cohorts (A). However, when considering β coefficients of all eplet mismatches, the general pattern of associations between each eplet mismatch and DSA development demonstrated notable correlations across various cohorts (B). Representative scatterplots (C and D) present the associations between the β coefficients derived from two cohorts indicated at the labels of x axis and y axis. A p value less than 5.0 × 10⁻³ (Bonferroni-corrected statistical significance threshold) is indicated by an asterisk (∗). In the weighted correlation analysis, p values were obtained using the t test for the correlation coefficient (rp). Error bars denote standard errors, while the gray area represents the 95% confidence intervals (CIs) of the regression lines.
Figure 5
Figure 5
Eplet risk score derivation using pediatric living-donor liver transplant cohort We employed the ridge model to assess the relationship between individual eplet mismatches and donor-specific antibody (DSA) development. Manhattan-style plots illustrate β coefficients, which served as the weights in the final model to compute the ERS for DR-DSA (DR-ERS) (A) and DQ-DSA (DQ-ERS) (B). These are represented on the y axis. The dot size corresponds to the log10-transformed p value, and color indicates the log-transformed hazard ratio (HR) from the primary analysis. Kaplan-Meier analysis verified that both DR-ERS and DQ-ERS accurately predicted DR-DSA and DQ-DSA development, respectively, in the pediatric living-donor liver transplant cohort (C and D). For ease of visualization, patients were stratified into three groups based on ERS tertiles: the DR-ERS tertile values were 0.22 and 0.87, and the DQ-ERS tertile values were 0.00 and 1.22. Donor-recipient pairs, n = 173 (pediatric living-donor liver transplant cohort). p values in the Kaplan-Meier analysis were derived from the log rank (Mantel-Cox) test, while those for HR came from the Wald test of the Cox proportional hazard model. In the Kaplan-Meier plots, vertical lines represent censored cases.
Figure 6
Figure 6
Eplet risk score validation in independent cohorts from liver, lung, and kidney transplantations across two transplant centers Boxplots show the distribution of the DR-ERS (A) and the DQ-ERS (B) values in six distinct cohorts compiled in this study. Participants were stratified into three groups according to their DR-ERS and DQ-ERS tertile values derived from the pediatric living-donor liver transplant cohort for Kaplan-Meier analyses. These analyses confirmed the association between ERS and DSA development in the adult living-donor liver transplant cohort (C and D), lung transplantation cohort (E and F), and kidney transplantation cohort (G and H). Donor-recipient pairs, n = 159 (adult living-donor liver transplant cohort), 333 (lung transplant cohort), and 313 (kidney transplant cohort). p values in the Kaplan-Meier analysis were calculated using the log rank (Mantel-Cox) test, while those for the hazard ratio (HR) were derived via the Wald test in the Cox proportional hazards model. In the boxplots, thick solid lines represent medians, boxes represent interquartile ranges (IQRs), and the error bars extending from the boxes represent the data within 1.5 × IQR. Vertical lines in the Kaplan-Meier plots denote censored cases.
Figure 7
Figure 7
Examination of eplet mismatch immunogenicity in mixed lymphocyte reactions The association between the eplet risk score (ERS) and the activation status of responder CD4+ T cells was analyzed. Representative scattergrams are shown in (A), and aggregated scatterplots are shown in (B). Each stimulator-responder pair was analyzed with 3–6 biological replicates. The effect of an anti-55PP antibody (Ab) or an anti-45EV Ab on the percentage of CFSElow CD4+ T cells in the MLR was assessed using a stimulator-responder pair (pair #4, see Table S9). Representative scattergrams are shown in (C), and aggregated data are shown in (D) and (E). Each antibody concentration group was analyzed with 4–12 biological replicates. ∗p < 0.05. p values were determined using the Wilcoxon rank-sum test, which compared the value at 0 ng/mL Ab with those at 1 × 10² and 1 × 10³ ng/mL Ab. EMn, the number of eplet mismatches; FSC, forward scatter; stim, stimulator. In the scatterplot shown in (B), large dots represent the median value of each stimulator-responder pair, small dots represent values obtained from each individual experiment, vertical lines represent ranges, and the gray area represents 95% confidence interval (CI) of the regression line. In the bar charts shown in (D) and (E), the top of the bar represents the median value, whereas the points represent values from individual experiments.

References

    1. Rodríguez-Perálvarez M., Germani G., Papastergiou V., Tsochatzis E., Thalassinos E., Luong T.V., Rolando N., Dhillon A.P., Patch D., O’Beirne J., et al. Early tacrolimus exposure after liver transplantation: relationship with moderate/severe acute rejection and long-term outcome. J. Hepatol. 2013;58:262–270. doi: 10.1016/j.jhep.2012.09.019. - DOI - PubMed
    1. Halloran P.F., Chang J., Famulski K., Hidalgo L.G., Salazar I.D.R., Merino Lopez M., Matas A., Picton M., de Freitas D., Bromberg J., et al. Disappearance of T Cell-Mediated Rejection Despite Continued Antibody-Mediated Rejection in Late Kidney Transplant Recipients. J. Am. Soc. Nephrol. 2015;26:1711–1720. doi: 10.1681/ASN.2014060588. - DOI - PMC - PubMed
    1. Loupy A., Lefaucheur C. Antibody-Mediated Rejection of Solid-Organ Allografts. N. Engl. J. Med. 2018;379:1150–1160. doi: 10.1056/NEJMra1802677. - DOI - PubMed
    1. Valenzuela N.M., Reed E.F. Antibody-mediated rejection across solid organ transplants: manifestations, mechanisms, and therapies. J. Clin. Investig. 2017;127:2492–2504. doi: 10.1172/JCI90597. - DOI - PMC - PubMed
    1. Lee B.T., Fiel M.I., Schiano T.D. Antibody-mediated rejection of the liver allograft: An update and a clinico-pathological perspective. J. Hepatol. 2021;75:1203–1216. doi: 10.1016/j.jhep.2021.07.027. - DOI - PubMed