. 2025 Jun 10;58(6):1438-1455.e10.
doi: 10.1016/j.immuni.2025.05.003. Epub 2025 May 30.

A CD4+ T cell-intrinsic complement C5aR2-prostacyclin-IL-1R2 axis orchestrates Th1 cell contraction

Affiliations

A CD4+ T cell-intrinsic complement C5aR2-prostacyclin-IL-1R2 axis orchestrates Th1 cell contraction

Jubayer Rahman et al. Immunity. .

Abstract

T helper 1 (Th1) cell initiation pathways are well characterized; however, those regulating their contraction are less understood. Here, we define a CD4+ T cell-autonomous pathway in which complement C5 orchestrated a shift from prostaglandin E2 (PGE2) dominance to enhanced prostacyclin (PGI2) production via activation of C5a receptor 2 (C5aR2). This pivot in lipid mediators induced autocrine signaling through the PGI2 receptor and expression of the interleukin-1 (IL-1) decoy IL-1 receptor type 2 (IL-1R2), which sequestered Th1 cell-driving intrinsic IL-1β, facilitating Th1 cell contraction. Disruption of this C5aR2-PGI2-R axis was a hallmark of pathologically persistent Th1 cell activity in inflammatory conditions, including cryopyrin-associated periodic syndromes (CAPS), Crohn's disease, and rheumatoid arthritis. Rebalancing this axis through selective PGE2 synthase inhibition rectified the hyperactive Th1 cell phenotype in vitro in T cells from individuals with CAPS. Therefore, complement is a key controller of prostanoid metabolism, and the latter is an intrinsic-and potentially druggable-checkpoint for the cessation of Th1 cell effector responses.

Keywords: C5aR2; CAPS; Crohn’s disease; IL-1β; Th1 cell responses; complement; complosome; cryopyrin-associated periodic fever syndrome; prostacyclin; prostaglandin; rheumatoid arthritis.


Conflict of interest statement

Declaration of interests The authors declare no competing interests.

Figures
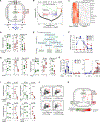
Figure 1.
Figure 1.. C5aR2 triggers CD4+ T cell-intrinsic prostacyclin generation and Th1 cell contraction
(A) Schematic of CD46- and C5aR1/2-controlled human Th1 cell induction (IFN-γ) and contraction (IL-10 co-induction) via modulation of CD4+ T cell-intrinsic IL-1β secretion. (B) Pathway analysis using differentially-expressed genes (DEGs) of human CD4+ T cells activated with CD3 + CD46 (6 h) with or without addition of a C5aR2 antagonist (C5aRA) (n = 3 donors, one experiment), and prostaglandin pathway is indicated in red and insert. (C) Heatmap depicting the top 10 DEGs derived from (B). (D) IFN-γ and IL-10 production and IFN-γ:IL-10 production ratio of CD3 + CD46 activated (36 h) T cells with or without concurrent incomplete COX-2 inhibition (5 μM) (n = 8, three independent experiments). (E) Schematic of major prostanoid synthesis enzymes and products downstream of COX-2-generated PGH2, including relevant prostanoid receptors. (F) Kinetics of PTGES2, TBXAS1, and PTGIS gene transcription in CD3 + CD46-activated CD4+ T cells (n = 4, two independent experiments). (G) IFN-γ and IL-10 production and IFN-γ:IL-10 production ratio of CD3 + CD46 activated (36 h) T cells with or without concurrent addition of either PGE2 (left) or prostacyclin (PGI2, right) at 12 h post activation (n = 4–6, four independent experiments). (H) Intrinsic PGE2 and PGI2 production by non-activated (NA) or subsorted IFN-γ+, IFN-γ+IL-10+, or IL-10+ T cells after CD3 + CD46 stimulation for either 2 or 36 h (n = 3–4, two independent experiments). 2 h stimulation generates IFN-γ+ cells only; thus, IFN-γ+ IL-10+ or IL-10+ cells could not be assessed (na) for prostanoid production at this time point. (I) IFN-γ and IL-10 production by CD3 + CD46 activated (36 h) T cells in which PTGES2, PTGIS, or PTGIR expression had been inhibited by siRNA treatment as indicated or which had been activated in the presence or absence of an EP4 inhibitor (20 μM) (n = 3, three independent experiments). (J) Effects of 15-PGDH inhibition with or without concurrent EP4 or PGI2-R antagonism on Th1 cell IFN-γ and/or IL-10 (co)producing cells at 36 h post CD3 + CD46 activation. Representative fluorescence-activated cell sorting (FACS) plots shown on the left (statistical analyses are summarized in Figure S1P) (n = 3–4, three independent experiments). (K) Schematic of C5aR2-controlled intrinsic PGE2 vs. PGI2 generation balance and subsequent effects on IFN-γ and IL-10 production by activated Th1 cells. Groups were compared using one-way ANOVA test or paired Student’s t test and error bars in graphs represent mean ± SD. *p < 0.05, **p < 0.01. See also Figure S1.
Figure 2.
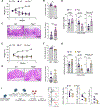
Figure 2.. The CD4+ T cell-intrinsic prostacyclin receptor restrains in vivo Th1 cell responses
(A) Body weight change of Rag2−/− mice injected with sorted naive CD4+ T cells isolated from wild-type (WT) or Ptgir−/− mice (n = 6–8, two independent experiments). (B) Colon length at the study endpoint (6 weeks) of mice as treated under (A). (C) Representative hematoxylin and eosin (H&E) colon tissue histology staining of mice injected with either WT or Ptgir−/− naive CD4+ T cells at 6 weeks post injection (left) with pathology scores across three colon sections/mouse (right) at 6 weeks post injection (n = 6–8, two independent experiments). (D) Percentages of IFN-γ- and IL-10-producing colonic CD4+ T cells re-isolated at the study endpoint (A–C) after phorbol myristate acetate (PMA) + ionomycin stimulation (5 h) (n = 6–8, two independent experiments). (E) Body weight change of Rag2−/− mice injected with sorted naive CD4+ T cells isolated from WT or Ptgis−/− mice (n = 4, one experiment). (F) Colon length at the study endpoint (6 weeks) of mice as treated under (E). (G) Representative H&E colon tissue histology staining of mice injected with either WT or Ptgis−/− naive CD4+ T cells at 6 weeks post injection (left) with pathology scores across three colon sections/mouse (right) at 6 weeks post injection (n = 4, one experiment). (H) Percentages of IFN-γ- and IL-10-producing colonic CD4+ T cells re-isolated at the study endpoint (E–G) after PMA + ionomycin stimulation (5 h) (n = 4, one experiment). (I) Schematic of influenza infection model used (left) with a representative FACS plot of IFN-γ and/or IL-10-producing lung, bone marrow (BM)-derived dendritic cell-restimulated CD4+ T cells (middle), and the summary of data from four animals used (right) (n = 4, one experiment). Groups were compared using paired or non-paired Student’s t test where appropriate, and error bars in graphs represent mean ± SD. *p < 0.05, **p < 0.01, ***p < 0.005. See also Figure S2.
Figure 3.
Figure 3.. PGI2-R limits intrinsic Th1 cell-sustaining IL-1β activity via IL-1R2 induction
(A) Volcano plot depicting differentially expressed genes (DEGs) between in vitro CD3 + CD28 stimulated (24 h) CD4+ T cells isolated from wild-type (WT) or Ptgir−/− mice (knockout [KO]) (n = 4, one experiment). (B) Heatmap showing the top DEGs derived from (A) (n = 4). (C) Percentage of surface IL-1R2-expressing CD3 + CD28-activated (72 h) mouse CD4+ T cells (natural Treg cell-depleted) isolated from WT, Ptgir−/−, or C5ar2−/− animals (n = 3–4, one experiment). (D) Schematic of influenza infection model used (left) with a representative FACS plot of IFN-γ and/or IL-10-producing lung, bone marrow (BM)-derived dendritic cell-restimulated CD4+ T cells (middle), and the summary of data from four animals used (right) (n = 4, one experiment). (E) Percentage of surface IL-1R2-expressing human CD4+ T cells (nTreg cell-depleted) after CD3 + CD28 or CD3 + CD46 activation (36 h) (n = 5, two independent experiments). (F) Impact of PGI2-R antagonism on IL-1R2 expression induction by CD3 + CD46 stimulation of CD4+ T cells (n = 3, two independent experiments). (G) IFN-γ and/or IL-10 production by IL-1R2negative/low, IL-1R2intermediate, and IL-2R2high T cells after CD3 + CD46 activation (36 h). Shown is a representative FACS plot (statistical analysis in Figure S3E, n = 3, three independent experiments). (H) IFN-γ+, IL-10+, and IFN-γ:IL-10+ T cell ratio of CD3 + CD46 activated (36 h) T cells with or without concurrent addition of a neutralizing antibody to IL-1R2 (n = 5, three independent experiments; −, cells treated with an isotype control). (I) Activated IL-1β protein amounts detected in culture media in experiments performed as described under (H) (n = 3). (J) Suggested model of T cell-intrinsic C5aR2/PGI2-R-induced IL-1R2 expression, which negatively controls cell-autonomous IL-1β production and enables timely Th1 cell IL-10 switching. Groups were compared using one-way or two-way ANOVA or the paired Student’s t test and error bars in graphs represent mean ± SD. *p < 0.05, **p < 0.01, ***p < 0.005. See also Figure S3.
Figure 4.
Figure 4.. PGI2-R mediates Th1 cell contraction through PKA activity
(A) Top increased (orange) and reduced (blue) biological pathways based on differentially expressed genes (DEGs) derived from in vitro CD3 + CD28 stimulated CD4+ T cells isolated from wild-type (WT) or Ptgir−/− (KO) mice (n = 4, one experiment). (B) Quantification of activated PKA (phosphorylated [pPKA], normalized to total PKA [tPKA]) in IFN-γ+IL-10, IFN-γ+IL-10+, and IFN-γIL-10+ CD4+ T cells generated by CD3 + CD46 activation (36 h) (n = 3, three independent experiments). (C) Amounts of pPKA in CD3 + CD46-activated T cells (18 h) (left) with or without addition of either PGE2 or PGI2 (right) (n = 5, three independent experiments). (D) Impact of PGE2 vs. PGI2 provision in the presence or absence of a PKA inhibitor (inh.) on IFN-γ and IL-10 production in CD3 + CD46-activated T cells (36 h). Representative FACS plots from one of three donors (left) with statistical analysis of cumulative data (right, n = 3, three independent experiments). (E) Effect of PKA inhibition on IL-1R2 expression by CD3 + CD46-activated T cells (36 h). Representative FACS plots from one of three donors (left) and statistical analysis of cumulative data (right, n = 3, two independent experiments). (F) Amounts of mRNAs encoding PTGES2, IL1R2, or IL10 in CD3 + CD46-activated T cells (8 h) with or without PGI2 addition to media assessed by quantitative PCR (n = 3, one experiment). (G) Effect of PGI2-R expression reduction by PTGIR siRNA treatment in CD3 + CD46-activated T cells (see also Figure S4E) on IL-10 expression and PKA and CREB activation (n = 3, three independent experiments). (H) Effect of PGI2-R expression reduction by PTGIR siRNA treatment in CD3 + CD46-activated T cells (48 h) on PTGES2, IL1R2, or IL10 transcription (n = 4–5, four independent experiments). (I) Schematic of the effects of PGE2-EP4 vs. PGI2-PGI2-R activity on CD4+ T cell PKA activation and transcription of indicated genes. The effect of PGI2-R engagement on IL10 transcription vs. translation is not clear (denoted by “?”). Groups were compared using one-way ANOVA or the Student’s t test. *p < 0.05, **p < 0.01, ***p < 0.005, ****p < 0.001. See also Figure S4.
Figure 5.
Figure 5.. Unbalanced intrinsic prostanoid metabolism limits Th1 cell contraction in individuals with CAPS
(A) IL-1β, IFN-γ, and IL-10 secreted by CD4+ T cells isolated from the indicated individuals with cryopyrin-associated periodic syndrome (CAPS) or sex- and age-matched healthy control donors (HDs) measured at 12–24 h post CD3 + CD46 activation (n = 5, five independent experiments). (B) Representative FACS plot of cell staining for IFN-γ and IL-10 production by HD3 and CAPS3 CD4+ T cells upon CD3 + CD46 activation (24 h) (of a total of n = 3, three independent experiments). (C) Expression of COX-2, PTGES2, and PTGIS in CD4+ T cells isolated from the indicated individuals with CAPS or HDs measured at 36 h post CD3 + CD46 activation (n = 3–4, three to four independent experiments). (D) Protein expression of C5aR2, PTGI2-R, and IL-1R2 in CD4+ T cells isolated from the indicated individuals with CAPS or HDs measured at 36 h post CD3 + CD46 activation (n = 3–4, three to four independent experiments). (E) IL-10 production by T cells isolated from indicated individuals with CAPS after CD3 + CD46 activation with or without either a specific PTGES2 inhibitor (MF63, 1 μM) or soluble IL-1R2 (5 μg/mL) at 12 h post activation (n = 6–7, six independent experiments). (F) Schematic detailing the shifted balance of the intrinsic prostanoid generation and response machinery toward PGE2 production underlying faulty IL-10 production in CAPS T cells, which could be rescued by PTGES2 inhibition or IL-1R2 provision. Groups were compared using the paired or non-paired Student’s t test, error bars in graphs represent mean ± SD. *p < 0.05, **p < 0.01. See also Figure S5.
Figure 6.
Figure 6.. C5aR2-PTGIS-PGI2-R axis perturbations demarcate autoimmunity-driving CD4+ T cells
(A) Outline for RNA-seq experiment where Foxp3 human CD4+ T cells were CD3 + CD46 stimulated (48 h) in the presence of either a scrambled control (scr) or PTGIR or PTGIS targeting siRNA and subsequent bulk RNA-seq of sorted IFN-γIL-10 and IFN-γ+ cells (n = 3, one experiment). (B) Volcano plots showing logFC and false discovery rate (FDR) values from differential expression testing, and PTGIR and PTGIS expression is highlighted in each plot. Significant DEGs are highlighted in blue/red, based on FDR < 0.05 and absolute logFC > 0.6 (n = 3, one experiment). (C) Venn diagram depicting the strategy employed to generate a PTGIS-PTGIR signature for downstream analyses. (D) Tissue sources of scRNA-seq datasets used for pathway analysis with intestinal datasets from healthy vs. individuals with Crohn’s samples and psoriatic arthritis (PSA) and juvenile idiopathic arthritis (JIA) datasets of matched blood and joint samples, respectively. (E) Uniform manifold approximation and projection (UMAP) representations of the three datasets used, showing cell clustering (upper UMAPs) and tissue status or origin (lower UMAPs) for each. (F) Heatmap of pathway analysis results from single-cell pathway analysis (SCPA). Each row represents a comparison of the specified cell type across conditions, e.g., the first row shows pathway changes in the Tem cell population in the blood of JIA vs. the joint, and so on. (G) Rank plot from SCPA focusing on the JIA dataset, highlighting the rank of the IFNG response (derived from an IFN signature indiscriminate of type I and II responses), PTGIR-PTGIS, and C5AR2 signatures across cell types. See also Figure S6.

References

    1. Jankovic D, Kugler DG, and Sher A (2010). IL-10 production by CD4+ effector T cells: a mechanism for self-regulation. Mucosal Immunol. 3, 239–246. 10.1038/mi.2010.8. - DOI - PMC - PubMed
    1. Khan U, and Ghazanfar H (2018). T Lymphocytes and Autoimmunity. Int. Rev. Cell Mol. Biol. 341, 125–168. 10.1016/bs.ircmb.2018.05.008. - DOI - PubMed
    1. West EE, Kolev M, and Kemper C (2018). Complement and the Regulation of T Cell Responses. Annu. Rev. Immunol. 36, 309–338. 10.1146/annurev-immunol-042617-053245. - DOI - PMC - PubMed
    1. Cardone J, Le Friec G, Vantourout P, Roberts A, Fuchs A, Jackson I, Suddason T, Lord G, Atkinson JP, Cope A, et al. (2010). Complement regulator CD46 temporally regulates cytokine production by conventional and unconventional T cells. Nat. Immunol. 11, 862–871. 10.1038/ni.1917. - DOI - PMC - PubMed
    1. Liszewski MK, Kolev M, Le Friec G, Leung M, Bertram PG, Fara AF, Subias M, Pickering MC, Drouet C, Meri S, et al. (2013). Intracellular complement activation sustains T cell homeostasis and mediates effector differentiation. Immunity 39, 1143–1157. 10.1016/j.immuni.2013.10.018. - DOI - PMC - PubMed

LinkOut - more resources