. 2025 Jul;301(7):110315.
doi: 10.1016/j.jbc.2025.110315. Epub 2025 May 29.

Quantification profiles of enzyme activity, secretion, and psychosine levels of Krabbe disease galactosylceramidase missense variants

Affiliations

Quantification profiles of enzyme activity, secretion, and psychosine levels of Krabbe disease galactosylceramidase missense variants

Hui Peng et al. J Biol Chem. 2025 Jul.

Abstract

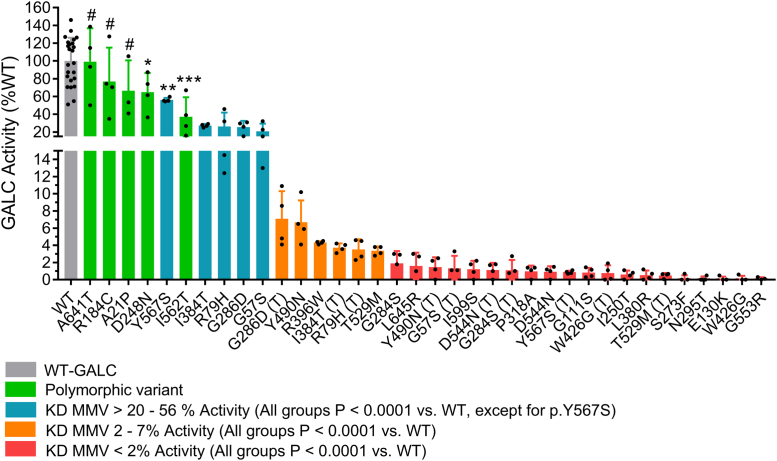
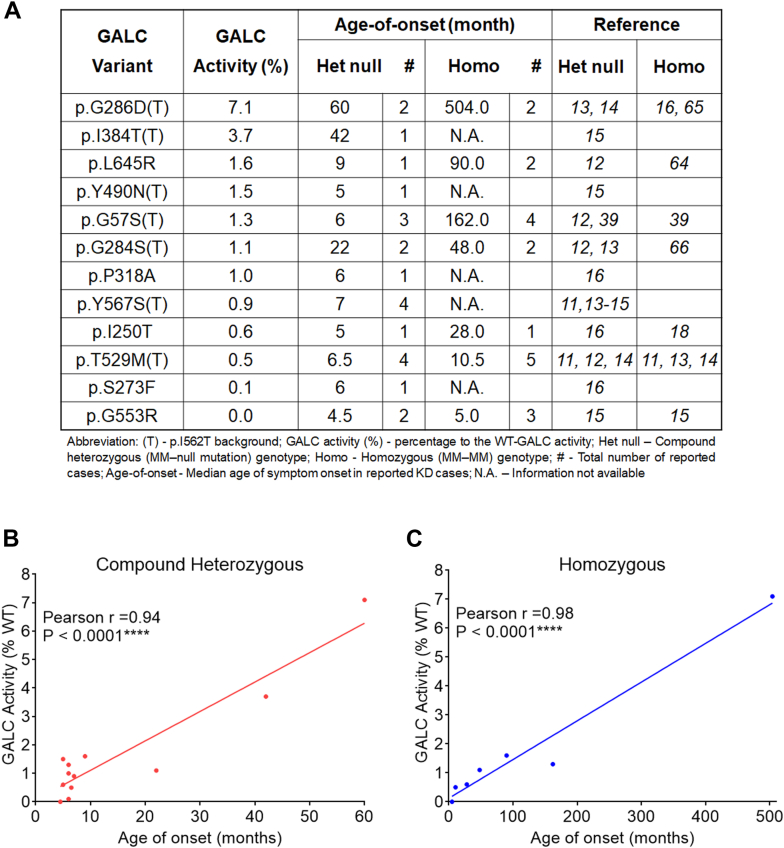
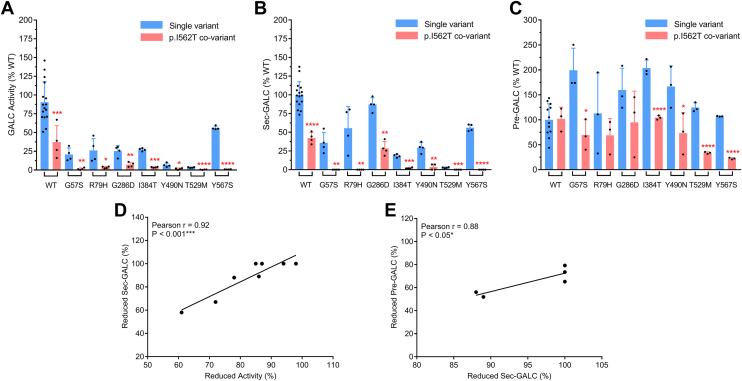
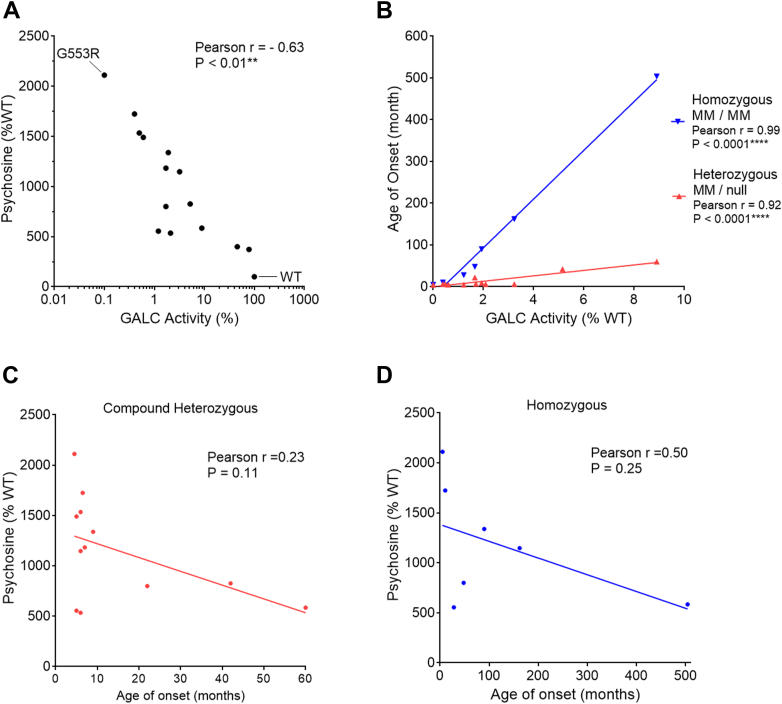
Krabbe disease is an autosomal recessive, demyelinating disorder caused by mutations in the GALC gene. Missense mutation variants (MMVs) account for most pathogenic alleles in patients; however, their mechanistic implications and correlations to clinical phenotype remain unclear. To address these questions, we generated a GALC knockout human oligodendrocytic cell line to conduct a robust GALC-MMVs expression study using a panel of 31 GALC-MMVs. Twenty-six clinically relevant variants dramatically reduced enzyme activity (92-100%). Notably, residual GALC activity strongly correlated with the age of disease-onset in reported cases (Pearson's r > 0.94, p < 0.0001), suggesting that enzyme activity resulting from MMV expression in this model may serve as a readout for clinical prognostication. In addition, we identified p.I562T, a predominant pseudodeficiency variant in the newborn screening programs, which synergistically impairs protein function and likely triggers disease-onset when inherited co-allelic with certain MMVs. We also identified MMVs that increased protein retention intracellularly and/or decreased secretion. This quantitative analysis of misfolding characteristics could be valuable for identifying MMVs amenable to pharmacological chaperone therapy. Finally, we observed an inverse correlation between residual GALC activity and endogenous psychosine levels in the MMV panel. Given the importance of psychosine as a biomarker for diagnosis and newborn screening, the psychosine accumulation phenotype in our model highlights its potential use for drug discovery. Overall, this study provides a comprehensive overview of the functional deficits and mis-trafficking caused by GALC-MMVs, deepens our understanding of molecular genetics and genotype-phenotype correlations in Krabbe disease, and highlights the potential of our platform for genetic and therapeutic applications.

Keywords: Krabbe disease; galactosylceramidase; genotype-phenotype correlation; lysosomal storage disorder; missense mutation variant; pathogenic variant expression study; protein mistrafficking; psychosine.


Conflict of interest statement

Conflict of interest The authors declare that they have no conflicts of interest with the contents of this article.

Figures

Figure 1
Figure 1
Subcellular trafficking and lysosomal processing of GALC protein.A, schematic illustration of GALC trafficking through subcellular compartments. After protein synthesis in the ER, precursor GALC (Pre-GALC) is transported through the Golgi to 1) the extracellular space via secretory vesicles, where it forms secreted GALC (Sec-GALC), or 2) lysosomes via the endosomal pathway, where it becomes lysosomal GALC (Lys-GALC). B, lysosomal processing of GALC. Pre-GALC undergoes proteolytic cleavage at sites located in the β-sandwich and lectin domains to form mature GALC within lysosomes. A carboxyl terminal lys-GALC fragment can be detected by Western blot using the CL13.1 anti-GALC antibody. ER, endoplasmic reticulum.
Figure 2
Figure 2
Location and distribution of KD-related MMVs on the human GALC protein. The schematic diagram shows the distribution of clinically relevant MMVs on the human GALC protein. Human Genome Variation Society (HGVS) nomenclature is applied. The main structural domains of GALC are indicated: signal peptide (SP) (1–42 a.a.), TIM barrel domain (57–353 a.a.), β-sandwich domain (354–468 a.a.), and lectin-binding domain (488–685 a.a). Key residues involved in catalytic function and substrate-binding are labeled in red. Polymorphic variants are labeled in blue. Active site variants are in bolded font. KD, Krabbe disease; MMV, missense mutation variant; TIM, triosephosphate isomerase.
Figure 3
Figure 3
Generation and validation of MO3.13/GALC-KO cells.A, human GALC gene sequences (red) adjacent to PAM sites (bolded) are targeted for Cas9-mediated cleavage by the sgRNA vectors. A downstream nonsense mutation (asterisk) is introduced upon successful targeted deletion (highlighted yellow). B, confirmation of targeted deletion of the 85 bp region in the KO cell line by PCR amplification, compared to control WT cells. C, Western blot analysis of GALC and GAPDH proteins in native MO3.13 cells (WT), GALC-KO cells (KO), and GALC-overexpressing cells (OE). D, GALC activity and (E) psychosine levels in WT and KO cells. Statistical significance is determined using an unpaired t test (two-tailed, 3–4 independent experimental replicates, 95% confidence interval, ∗∗p < 0.01, ∗∗∗p < 0.001). PAM, protospacer adjacent motif.
Figure 4
Figure 4
Differential proteome of MO3.13 native cells (WT) and MO3.13/GALC-KO (KO) cells.A, proteomics workflow. Proteins extracted from WT and KO cells were separated by SDS-PAGE. After in-gel digestion, peptides were labeled with tandem mass tags (TMTs) and high-pH reversed-phase fractioned. Peptides were identified and quantified by liquid chromatography mass spectrometry (LC/MS) using synchronous precursor selection (SPS) and MS3 method, and the differential expression profile between WT and KO cells was elucidated. B, volcano plot. A total of 2417 proteins were identified and quantified. Three hundred sixty-six proteins were identified as differentially expressed in KO versus WT cells (two-tailed t test; adjusted p value (Benjamini–Hochberg) < 0.05). A p value of 0.05 (-log10 0.05 = 1.301) is indicated by a gray line. Differentially expressed proteins with a 1.25-fold change (KO/WT: log2 < −0.32 or > 0.32) are highlighted (upregulated in red; downregulated in blue). C, differentially expressed proteins. Scaled abundances of the 366 differentially expressed proteins are represented in a heat map in descending order based on average log2-fold change. The color intensity scale is arbitrary. D, differently expressed lysosomal proteins and proteins in the ceramide synthesis pathway. Percent change (KO versus WT), p values, and adjusted p values are listed. Scaled abundances of the target proteins are shown in a heat map in descending order based on average log2-fold change. The color intensity scale is arbitrary.
Figure 5
Figure 5
Dramatic reduction of GALC activity in 26 clinically relevant MMVs. Residual GALC activity in transiently expressed cell models was measured in cell lysate and presented as relative percent of WT-GALC. MMVs are ranked in descending order based on GALC activity. Of the MMVs eliciting significant reductions compared to WT-GALC, seven variants had activity that remained relatively high (20–70% of WT, blue bars and I562T); six variants had low level activity (2–7% of WT, orange bars); and 20 variants had little to no activity (0–2% of WT, red bars). MMVs on the p.I562T background are annotated with (T). Data are presented as mean ± standard deviation from four independent experiments. Individual MMV (n = 4) was compared to WT (n = 24) by an unpaired t test (two-tailed, 95% confidence interval, ∗p < 0.05, ∗∗p < 0.01, ∗∗∗p < 0.001, # - no significant difference). MMV, missense mutation variant.
Figure 6
Figure 6
GALC activity in MMV cell models is highly correlated with the age of clinical onset in KD patients carrying the same GALC MMV genotypes.A, GALC activity levels in MMV cell models and the age of symptom onset in KD patients with either compound heterozygous MM-null mutation or homozygous MM-MM genotypes, based on reported cases from literature. B and C, correlation analysis between GALC activity and the age of symptom onset in KD patients with (B) heterozygous MM-null mutation genotypes (Pearson r = 0.94, p < 0.0001, n = 12) or (C) homozygous MM-MM genotypes (Pearson r = 0.98, p < 0.0001, n = 7). KD, Krabbe disease; MMV, missense mutation variant.
Figure 7
Figure 7
Lys-GALC levels are highly correlated with GALC activity.AD, Western blot results of lys-GALC and GAPDH in the lysate of GALC MMV expressing cells. Panel (C and D) shows MMVs in the absence (−) and presence (+) of the p.I562T polymorphic background. E, Lys-GALC levels (normalized to GAPDH levels) are highly correlated with GALC activity in the GALC MMV cell models (Pearson r = 0.93, p < 0.0001, n = 37). F, expanded plot of the red line area shown in (E). MMVs with lys-GALC levels greater than 1% are labeled in (E) and (F). MMV, missense mutation variant.
Figure 8
Figure 8
GALC secretion is more impaired by MMVs located on the β-sandwich and lectin protein domains but does not correlate to the age of symptom onset in KD patients.A, Sec-GALC levels are plotted against the structural location of GALC MMVs, categorized by their position on the TIM barrel (red), β-sandwich (green), and lectin-binding (blue) domains. MMVs (11/12) significantly reduced sec-GALC levels compared with WT-GALC, specifically on the β-sandwich and lectin domains in our cell models. (Unpaired t test, two-tailed, four independent experimental replicates, 95% confidence interval; ∗p < 0.05, ∗∗p < 0.01, ∗∗∗p < 0.001, ∗∗∗∗p < 0.0001). B and C, analysis reveals no significant correlation between sec-GALC levels and the age of symptom onset in KD patients with (B) heterozygous MM-null mutation genotypes or (C) homozygous MM-MM genotypes. KD, Krabbe disease; MMV, missense mutation variant; TIM, triosephosphate isomerase.
Figure 9
Figure 9
Accumulation of pre-GALC protein in GALC MMV cell models.A, intracellular pre-GALC and GAPDH proteins were detected by Western blot. The bottom two blots show MMVs in the absence (−) and presence (+) of the p.I562T polymorphic background. The same GAPDH blots were used to normalize both pre-GALC (current panel) and lys-GALC protein levels (Fig. 7, AD), as pre-GALC and lys-GALC were detected on the same blot but at different molecular weights. B, pre-GALC levels (normalized to GAPDH) detected by Western blot are significantly correlated with pre-GALC levels measured by sandwich ELISA in the MMV cell models (Pearson r = 0.71, p < 0.0001, n = 35). C, pre-GALC levels measured by ELISA plotted against the structural location of the MMVs, categorized by their position on the TIM barrel (red), β-sandwich (green) and lectin-binding (blue) domains. Ten out of 22 MMVs significantly increase pre-GALC levels compared with WT-GALC in the MMV cell models. (Unpaired t test, two-tailed, three independent experimental replicates, 95% confidence interval; ∗∗p < 0.01, ∗∗∗p < 0.001, ∗∗∗∗p < 0.0001). MMV, missense mutation variant; TIM, triosephosphate isomerase.
Figure 10
Figure 10
p.I562T background reduced GALC activity, sec-GALC levels and pre-GALC levels in the MMV cell models.A, GALC activity, (B) sec-GALC levels and (C) pre-GALC levels from MMV expressing cells containing the p.I562T variant and seven other p.I562T co-variants (red bars) are compared side-by-side with those from WT cells or cells expressing the corresponding single variants (blue bars), respectively. (Unpaired t test, two tails, three to four independent experimental replicates, 95% confidence interval; ∗∗p < 0.01, ∗∗∗p < 0.001, ∗∗∗∗p < 0.0001). D, the percentage reductions of GALC activity are highly correlated with the percentage reductions in sec-GALC levels in MMV expressing cells containing the p.I562T and seven other p.I562T co-variants (Pearson r = 0.92, p < 0.001, n = 8). E, reductions in sec-GALC levels (%) correlated with the reductions in intracellular pre-GALC levels (%) in five p.I562T covariants (Pearson r = 0.88, p < 0.05, n = 5). MMV, missense mutation variant.
Figure 11
Figure 11
GALC activity correlates with sec-GALC levels in the MMV cell models. Correlations among GALC activity, sec-GALC levels, and pre-GALC protein levels in the GALC MMV expressing cells were analyzed using the Pearson correlation method. A, GALC activity is significantly correlated with sec-GALC levels in the cell models (Pearson r = 0.5, p < 0.01, n = 37). No significant correlations are found between (B) GALC activity and pre-GALC levels, and between (C) sec-GALC and pre-GALC levels. MMV, missense mutation variant.
Figure 12
Figure 12
Cellular psychosine levels correlate with GALC activity in MMV cell models, but do not correlate with the onset of clinical symptoms in KD patients.A, expression studies were conducted in MO3.13/GALC-KO cells for WT, p.I562T, and 12 clinically relevant GALC MMVs. Quantification of intracellular psychosine, GALC activity, and sec-GALC levels are summarized in Table 4. Psychosine levels significantly correlated with GALC activity (Pearson r = −0.63, p < 0.01, n = 15). B, consistent with our transient expression study (Table 3, Fig. 5), GALC activity was also highly correlated with the age of symptom-onset in KD patients with either homozygous MM-MM (Pearson r = 0.99, p < 0.0001, n = 7) or compound heterozygous MM-null mutation genotypes (Pearson r = 0.92, p < 0.0001, n = 12). C and D, however, psychosine levels were not significantly correlated with the age of symptom-onset, in either (C) compound heterozygous or (D) homozygous MMV genotypes. KD, Krabbe disease; MMV, missense mutation variant.
Figure 13
Figure 13
Dramatic reduction in GALC secretion in 50% of the low-activity GALC MMVs.A, summary table listing GALC activity, sec-GALC levels, and intracellular pre-GALC levels for 26 low-activity GALC MMVs. Values are presented as percentages relative to WT-GALC levels. The color spectrum from green to red indicates values from high to low within each group. “ns” denotes no significant difference from WT-GALC. B, distribution of sec-GALC levels among the 26 low-activity GALC-MMVs. The red, blue, and gray sections of the pie chart represent MMVs with sec-GALC levels of 0% to 4%, 10% to 80%, and 100% of WT levels, respectively. MMV, missense mutation variant.

Update of

References

    1. Suzuki K., Taniike M. Murine model of genetic demyelinating disease: the twitcher mouse. Microsc. Res. Tech. 1995;32(3):204–214. - PubMed
    1. Kondo Y., Duncan I.D. Myelin repair by transplantation of myelin-forming cells in globoid cell leukodystrophy. J. Neurosci. Res. 2016;94(11):1195–1202. - PubMed
    1. Scott-Hewitt N.J., Folts C.J., Hogestyn J.M., Piester G., Mayer-Pröschel M., Noble M.D. Heterozygote galactocerebrosidase (GALC) mutants have reduced remyelination and impaired myelin debris clearance following demyelinating injury. Hum. Mol. Genet. 2017;26(15):2825–2837. - PMC - PubMed
    1. Feltri M.L., Weinstock N.I., Favret J., Dhimal N., Wrabetz L., Shin D. Mechanisms of demyelination and neurodegeneration in globoid cell leukodystrophy. Glia. 2021;69(10):2309–2331. - PMC - PubMed
    1. Iacono D., Koga S., Peng H., Manavalan A., Daiker J., Castanedes-Casey M., et al. Galactosylceramidase deficiency and pathological abnormalities in cerebral white matter of Krabbe disease. Neurobiol. Dis. 2022;174 - PMC - PubMed

MeSH terms