. 2025;19(10):101548.
doi: 10.1016/j.jcmgh.2025.101548. Epub 2025 May 29.

MFAP4 Deficiency Attenuates Liver Fibrosis by Regulating Hepatic Stellate Cell Fate Through Inhibition of the FAK/PI3K/NFκB Signaling Pathway

Affiliations

MFAP4 Deficiency Attenuates Liver Fibrosis by Regulating Hepatic Stellate Cell Fate Through Inhibition of the FAK/PI3K/NFκB Signaling Pathway

Linxiang Liu et al. Cell Mol Gastroenterol Hepatol. 2025.

Abstract

Background & aims: Liver fibrosis, driven by chronic injury, hinges on hepatic stellate cells (HSCs) activation. Microfibrillar-associated protein 4 (MFAP4), an extracellular matrix protein critical for elastic fiber assembly, is up-regulated in hepatic fibrosis, yet its mechanistic role remains unclear.

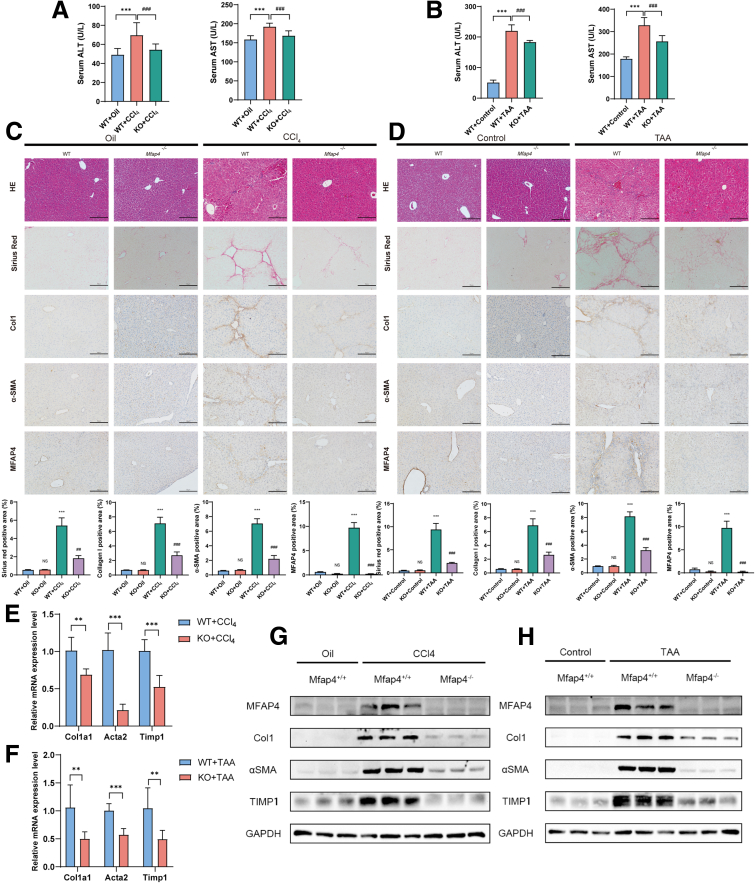
Methods: Liver fibrosis was induced in wild-type and Mfpa4 knockout mice using CCl4 and TAA, whereas LX-2 cells were activated with transforming growth factor-β1. Bioinformatics analysis, histopathology, double immunofluorescence, flow cytometry, Transwell coculture systems, Western blot, and quantitative polymerase chain reaction were used to identify the primary intrahepatic cell types expressing MFAP4 and assess its effects on HSCs activation and apoptosis.

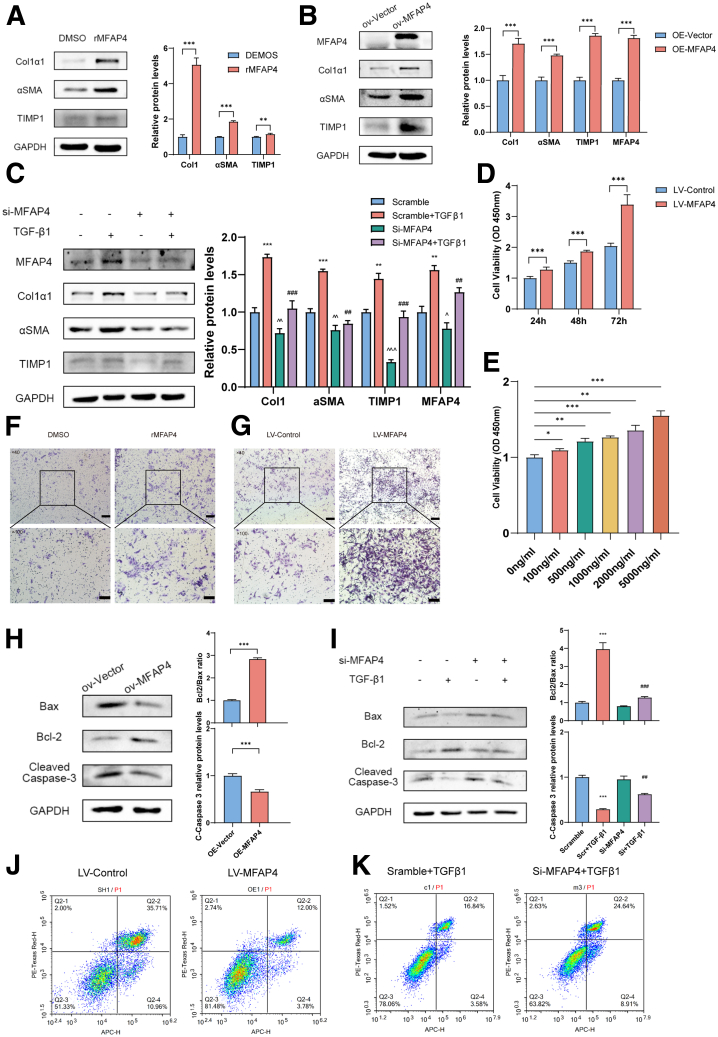
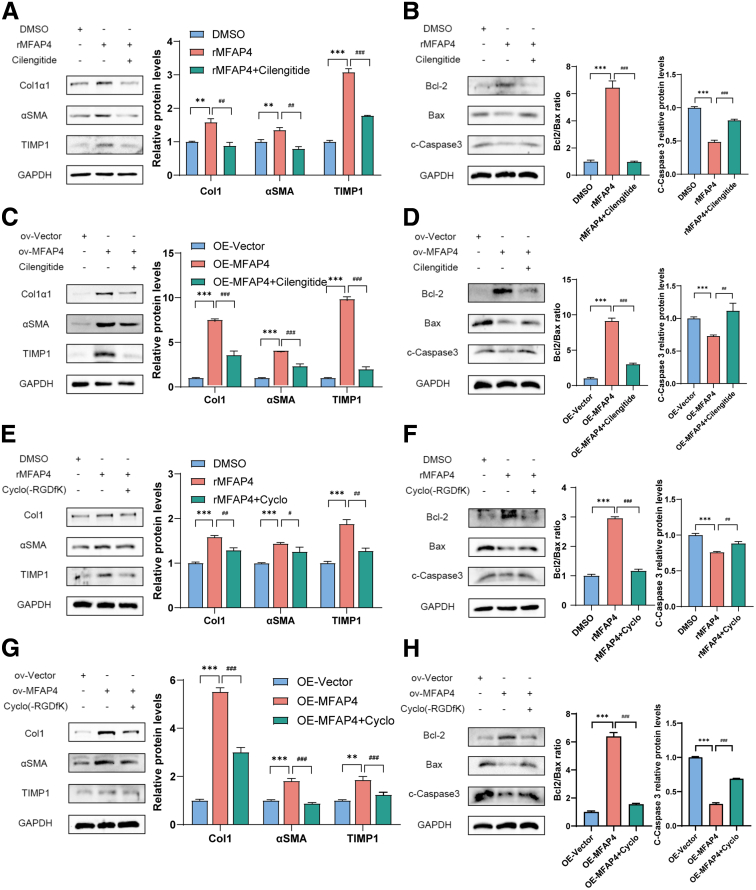
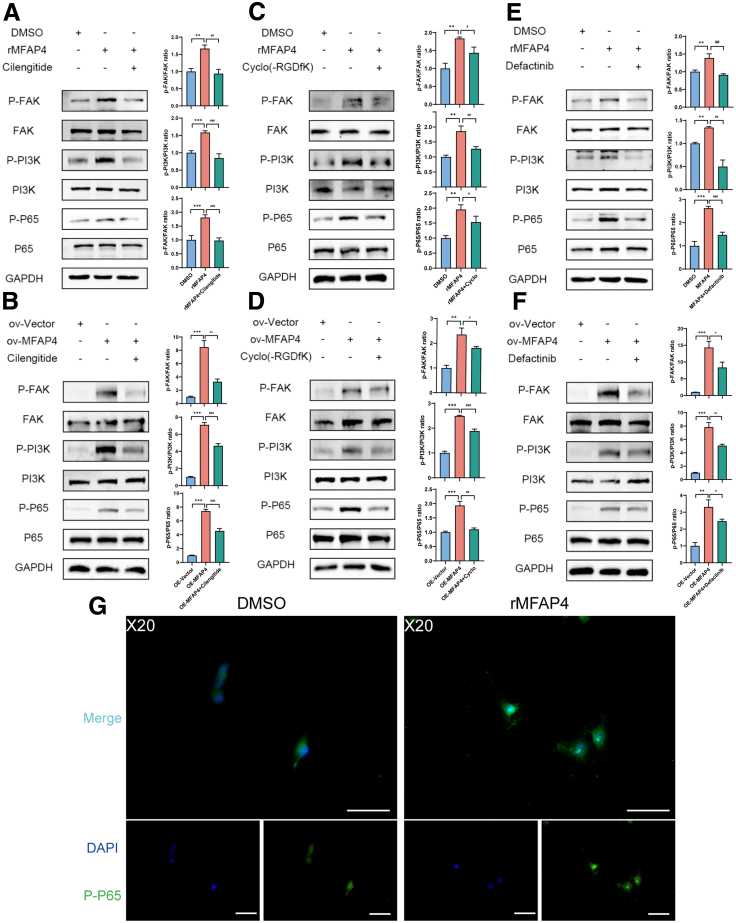
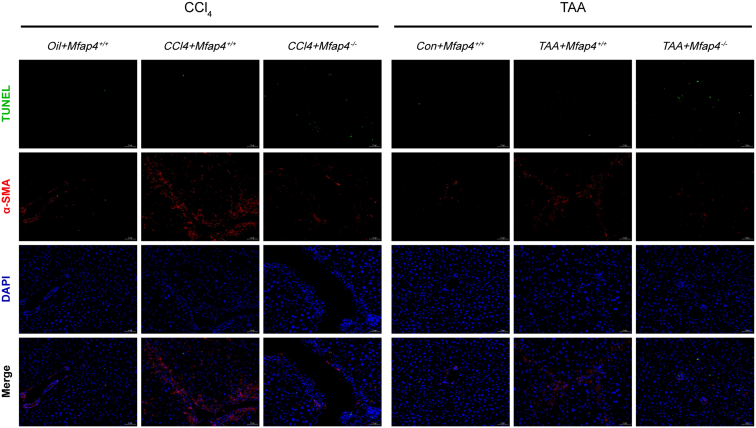
Results: MFAP4 is up-regulated in cirrhotic livers and is actively expressed in HSCs. Single-cell RNA sequencing analysis and Transwell coculture experiments revealed that the profibrotic effects of MFAP4 were primarily mediated through HSCs rather than hepatocytes. Inhibition of MFAP4 significantly reduces the expression of fibrosis markers in HSCs, inhibits their proliferation and migration, whereas overexpression of MFAP4 results in the opposite effect, accompanied by enhanced apoptosis resistance. In mouse models, global knockout of Mfap4 significantly alleviates CCl4- and TAA-induced liver fibrosis. Mechanistic analysis reveals that MFAP4 binds to integrin αvβ3 on the HSCs membrane, activating the FAK/PI3K/NFκB signaling pathway, which promotes HSC activation and survival, ultimately exacerbating liver fibrosis. Moreover, MFAP4 mediates a self-sustaining feedback loop via integrin αvβ3, maintaining HSCs activation and further promoting fibrosis progression.

Conclusions: MFAP4 governs HSCs activation and apoptosis resistance via integrin αvβ3-dependent FAK/PI3K/NFκB signaling. Targeting MFAP4 mitigates fibrosis by altering HSCs fate.

Keywords: Cell Fate; Hepatic Stellate Cell; Integrin; Liver Fibrosis; MFAP4.


Figures

None
Graphical abstract
Figure 1
Figure 1
Expression levels of MFAP4 in public datasets and human cirrhotic liver tissues. (A) Expression of MFAP4 in the GEO dataset (GSE14323) and its correlation with COL1A1, ACTA2, and TIMP1 expression. (B) Expression of MFAP4 in the GEO dataset (GSE84044), its association with liver fibrosis grades, and its correlation with COL1A1, ACTA2, and TIMP1 expression. (C) Representative images of immunohistochemical staining for MFAP4, COL1, and α-SMA, along with Sirius Red staining, in healthy human liver tissues and cirrhotic human liver tissues. Quantification of the positively stained area were shown at right. ∗∗P < .01, ∗∗∗P < .001, ∗∗∗∗P < .0001. Scale bar = 50 μm.
Figure 2
Figure 2
Expression levels of MFAP4 human cirrhotic liver tissues. Immunohistochemical staining for MFAP4, Col1, and α-SMA, along with Sirius Red staining, in healthy human liver tissues and cirrhotic human liver tissues. Scale bar = 50 μm.
Figure 3
Figure 3
Successful establishment of 2 liver fibrosis mouse models, and elevated expression of MFAP4 in fibrotic liver tissues and activated HSCs. (A) Representative images of HE staining, Sirius Red staining, and immunohistochemical staining of Col1, α-SMA, and MFAP4 in liver tissues after 6 weeks of CCl4 induction and (B) quantification of the positive staining areas (n = 6 mice/treatment groups). (C) Representative images of liver histology after 12 weeks of TAA induction, including HE staining, Sirius Red staining, and immunohistochemistry for Col1, α-SMA, and MFAP4 and (D) quantification of the positive staining areas (n = 6 mice/treatment groups). (E) qPCR analysis of the expression levels of Col1a1, Acta2, TIMP1, and MFAP4 in total mRNA extracted from CCl4-induced fibrotic liver tissues (n = 6 mice/treatment groups). (F) qPCR analysis of the expression levels of Col1a1, Acta2, TIMP1, and MFAP4 in total mRNA extracted from TAA-induced fibrotic liver tissues (n = 6 mice/treatment groups). (I) qPCR analysis of the mRNA levels of Col1a1, Acta2, TIMP1, and MFAP4 in LX-2 cells after 24 hours of incubation with 10 ng/mL TGF-β1. Western blot analysis of the expression levels of Col1, α-SMA, TIMP1, and MFAP4 in CCl4 (G) or TAA (H) induced liver fibrosis models (n = 6 mice/treatment groups). (J) Western blot analysis of the expression levels of Col1, α-SMA, TIMP1, and MFAP4 in LX-2 cells after 24 hours of incubation with 10 ng/mL TGF-β1. (K) Enzyme-linked immunosorbent assay analysis of MFAP4 levels in the culture medium of LX-2 cells after 24-hour incubation with 10 ng/mL TGF-β1. ∗∗P < .01, ∗∗∗P < .001. Scale bars: 50 μm in ×100 magnification, 25 μm in ×200 magnification.
Figure 4
Figure 4
Single-cell transcriptomic profiling of CCl4-induced fibrosis. (A-C) UMAP plots showing intrahepatic cell clusters and experimental groups, with FeaturePlot displaying Mfap4 expression in hepatic cells. (D-F) UMAP plots of HSC subclusters and experimental groups, with FeaturePlot showing Mfap4 expression in HSCs.
Figure 5
Figure 5
MFAP4 deficiency alleviates liver fibrosis induced by CCl4 and TAA. (A) Serum levels of alanine aminotransferase (ALT) (U/L) and aspartate aminotransferase (AST) (U/L) in WT+Oil, WT+CCl4, and KO+CCl4 mice groups (n = 5 mice/treatment groups). (B) Serum levels of ALT (U/L) and AST (U/L) in WT+TAA, WT+TAA, and KO+TAA mice groups (n = 5 mice/treatment groups). (C) Representative images of HE staining, Sirius Red staining, and immunohistochemical staining for Col1, α-SMA, and MFAP4 in liver tissues from WT+Oil, KO+Oil, WT+CCl4, and KO+CCl4 groups after 6 weeks of treatment. Quantification of the positive staining areas is shown below (n = 6 mice/treatment groups). (D) Representative images of HE staining, Sirius Red staining, and immunohistochemical staining for Col1, α-SMA, and MFAP4 in liver tissues from WT+Control, KO+Control, WT+TAA, and KO+TAA groups after 12 weeks of treatment. Quantification of the positive staining areas is shown below (n = 6 mice/treatment groups). qPCR analysis of the expression levels of Col1a1, Acta2, and Timp1 in total mRNA extracted from liver tissues of CCl4 (E) and TAA (F) induced fibrotic mice (n = 6 mice/treatment groups). (G) Western blot analysis of the expression levels of total Col1, α-SMA, and TIMP1 in liver tissues from Mfap4+/+ and Mfap4-/- mice in the Oil- or CCl4-induced liver fibrosis model (n = 6 mice/treatment groups). (H) Western blot analysis of the expression levels of total Col1, α-SMA, and TIMP1 in liver tissues from Mfap4+/+ and Mfap4-/- mice in the control- or TAA-induced liver fibrosis model (n = 6 mice/treatment groups). Quantification of the positive staining areas: ∗Indicates a statistically significant difference between the WT+Oil and WT+CCl4 groups or between the WT+Control and WT+TAA groups, with ∗∗∗P < .001. #Indicates a statistically significant difference between the WT+CCl4 and KO+CCl4 groups or between the WT+TAA and KO+TAA groups, with ###P < .001. NS denotes no statistically significant difference between the WT+Oil and KO+Oil groups or between the WT+Control and KO+Control groups. ∗∗P < .01, ∗∗∗P < .001. Scale bars: 50 μm.
Figure 6
Figure 6
The expression of MFAP4 is associated with fibrotic and apoptotic phenotypes. (A) Western blot analysis of Col1, α-SMA, and TIMP1 expression levels in whole cell lysates from LX-2 cells incubated with either control solvent DMSO or 2000 ng/mL rMFAP4 for 24 hours. Quantification of immunoblot results is shown on the right. (B) Western blot analysis of Col1, α-SMA, TIMP1, and MFAP4 expression levels in whole cell lysates from LX-2 cells transfected with either control vector or OE-MFAP4 plasmid for 72 hours. Quantification of immunoblot results is shown on the right. (C) Western blot analysis of Col1, α-SMA, TIMP1, and MFAP4 expression levels in whole cell lysates from LX-2 cells treated with control Scramble, Scramble+TGFβ1, Si-MFAP4, and Si-MFAP4+TGFβ1 for 72 hours. Quantification of immunoblot results is shown on the right. (D, E) CCK-8 assay was performed to measure the cell proliferation after treatment with OE-MFAP4 for various time points or different concentrations of rMFAP4. (F, G) Cell migration ability after OE-MFAP4 or after cells were treated with rMFAP4. (H, I) Western blot analysis of Bcl-2, Cleaved caspase-3, and Bax protein levels in total LX-2 cell lysates after OE-MFAP4 or Si-MFAP4. The Bcl-2/Bax ratio and the relative expression levels of Cleaved caspase-3 are presented. (J, K) Representative images of flow cytometry analysis showing the levels of apoptosis in LX-2 cells after OE-MFAP4 or Si-MFAP4. In the knockdown experiment: ∗indicates a statistically significant difference between the Scramble and Scramble+TGFβ1 groups, #indicates a statistically significant difference between the Si-MFAP4 and Si-MFAP4+TGFβ1 groups, and ˆindicates a statistically significant difference between the Scramble and Si-MFAP4 groups. Scale bars: 50 μm in ×40 magnification, 25 μm in ×100 magnification. ∗P < .05, ∗∗P < .01, ∗∗∗P < .001.
Figure 7
Figure 7
si-MFAP4 knockdown efficiency, and MFAP4 promotes HSCs proliferation and intrahepatic localization. (A) Validation of siRNA knockdown efficiency. qPCR and WB validation of Control group, Negative control group, and 3 MFAP4-knockdown siMFAP4 groups. NS denotes no statistically significant difference between the Control and Scramble groups. ∗∗P < .01, ∗∗∗P < .001. (B) CCK-8 assay showing proliferative changes of LX-2 cells treated with BSA negative control versus rMFAP4. (C) CCK-8 assay showing proliferative changes of LX-2 cells treated with TGF-β1 positive control versus rMFAP4. NS denotes no statistically significant difference between the BSA and treatment groups. ∗P < .05, ∗∗P < .01, ∗∗∗P < .001. (D) Representative immunofluorescence images showing colocalization of ALB (hepatocyte marker, red) and MFAP4 (green) in CCl4-induced fibrotic mouse liver. Scale bars = 200 μm. (E) Immunofluorescence analysis of α-SMA (activated HSCs marker, red) and MFAP4 (green) in CCl4-induced fibrotic liver tissues. Scale bars = 200 μm.
Figure 8
Figure 8
HSCs-derived MFAP4 plays a central regulatory role in liver fibrosis. (A) In LX-2 cells, TGF-β1 stimulation significantly up-regulated MFAP4, COL1A1, and ACTA2 mRNA levels in a time-dependent manner. NS denotes no statistically significant difference between the Control and TGF-β1 groups. NS denotes no statistically significant difference between the Control and β groups. ∗∗P < .01, ∗∗∗P < .001. ∗∗∗P < .001 versus untreated controls. (B) In TGF-β1-treated THLE-2 cells, MFAP4 expression showed minimal changes. ∗P < .05, ∗∗∗P < .001 versus untreated controls. (C) Western blot analysis confirmed baseline MFAP4 expression in HSCs and hepatocytes, with TGF-β1-induced MFAP4 up-regulation specifically observed in HSCs. (D) Schematic diagram of the Transwell coculture system for hepatocyte-HSCs interaction studies. (E) Western blot analysis of cocultured HSCs demonstrated that MFAP4 knockdown in HSCs (vs hepatocytes) significantly reduced fibrotic markers (α-SMA, Col1)and MFAP4 expression.
Figure 9
Figure 9
Increased expression of integrin αvβ3 in fibrotic liver tissue and activated HSCs, with MFAP4 binding to integrin αvβ3 on activated HSCs. (A, B) Western blot analysis showing up-regulation of integrin αvβ3 expression in fibrotic liver tissue, (C) and increased expression of integrin αvβ3 in activated HSCs. Coimmunoprecipitation (Co-IP) assays. IP was performed using antibodies against integrin αv (D), integrin β3 (E), and MFAP4 (F) to capture the respective protein complexes. (I) Double immunofluorescence staining for MFAP4 and integrin αv or β3 in activated LX-2 cells. Scale bars: 25 μm. (G) Double immunofluorescence staining for MFAP4, α-SMA, and integrin αv or β3 in CCl4-induced fibrotic liver tissue. (H) Double immunofluorescence staining for MFAP4, α-SMA, and integrin αv or β3 in TAA-induced fibrotic liver tissue. Scale bars: 50 μm.
Figure 10
Figure 10
The partial reversal of the MFAP4-induced phenotype by pathway inhibitors. The fibrotic and apoptotic phenotypes induced by rMFAP4 incubation in LX-2 cells and by MFAP4 overexpression in LX-2 cells can be partially reversed by the integrin αvβ3 inhibitors Cilengitide (1 μM) (A-D) and Cyclo(-RGDfK) (2 μM) (G-H). Quantitative analysis of Western blotting is shown on the right. ∗Indicates a statistical significance between the rMFAP4 or OE-MFAP4 group and the DMSO or OE-Vector group; #Indicates statistical significance between the rMFAP4 or OE-MFAP4 group and the rMFAP4 + inhibitor group or OE-MFAP4 + inhibitor group. ∗∗P < .01, ∗∗∗P < .001. #P < .05, ##P < .01, ###P < .001.
Figure 11
Figure 11
The relationship between MFAP4 and the activation of the FAK/PI3K/NFκB signaling pathway. (A, B) The integrin αvβ3 inhibitor Cilengitide (1 μM) partially reverses the activation of the FAK/PI3K/NFκB signaling pathway induced by rMFAP4 incubation or OE-MFAP4 in LX-2 cells. (C, D) Another integrin αvβ3 inhibitor, Cyclo(-RGDfK) (2 μM), partially reverses the activation of the FAK/PI3K/NFκB signaling pathway induced by rMFAP4 incubation or OE-MFAP4 in LX-2 cells. (E, F) The FAK-specific inhibitor Defactinib hydrochloride (10 μM) partially reverses the activation of the FAK/PI3K/NFκB signaling pathway induced by rMFAP4 incubation or OE-MFAP4 in LX-2 cells. Quantification of immunoblot results is shown on the right. (G) Immunofluorescence showing nuclear translocation of p-P65 in LX-2 cells after 24 hours of rMFAP4 incubation. Scale bars: 25 μm.
Figure 12
Figure 12
In vivo showing that the absence of MFAP4 alleviates the activation of the FAK/PI3K/NFκB signaling. (A, B) Activation of the FAK/PI3K/NFκB signaling pathway in CCl4 and TAA-induced fibrotic livers. Quantification of immunoblot results is shown on the right (n = 6 mice/treatment groups). (C, D) Reduced activation of the FAK/PI3K/NFκB pathway in fibrotic livers of Mfap4-/- mice compared to Mfap4+/+ mice. Quantification of immunoblot results is shown on the right (n = 6 mice/treatment groups). (E) Immunofluorescence analysis of p-P65 nuclear translocation in CCl4 or TAA-induced fibrotic livers. (F) Double immunofluorescence staining of αSMA and Cleaved Caspase3 for analysis of HSC apoptosis in fibrotic liver of Mfap4+/+ and Mfap4−/− mice. Scale bars: 25 μm (E) or 200 μm (F). ∗P < .05, ∗∗P < .01, ∗∗∗P < .001.
Figure 13
Figure 13
Apoptosis detection in HSCs from fibrotic liver. TUNEL assay for apoptosis detection and α-SMA immunofluorescence analysis of HSCs apoptosis in fibrotic livers of and Mfap4+/+ and Mfap4-/- mice. Scale bars: 50 μm.

References

    1. Kisseleva T., Brenner D. Molecular and cellular mechanisms of liver fibrosis and its regression. Nat Rev Gastroenterol Hepatol. 2021;18:151–166. - PubMed
    1. Friedman S.L. Hepatic stellate cells: protean, multifunctional, and enigmatic cells of the liver. Physiol Rev. 2008;88:125–172. - PMC - PubMed
    1. Meng D., Li Z., Wang G., et al. Carvedilol attenuates liver fibrosis by suppressing autophagy and promoting apoptosis in hepatic stellate cells. Biomed Pharmacother. 2018;108:1617–1627. - PubMed
    1. Koda Y., Teratani T., Chu P.-S., et al. CD8+ tissue-resident memory T cells promote liver fibrosis resolution by inducing apoptosis of hepatic stellate cells. Nat Commun. 2021;12:4474. - PMC - PubMed
    1. Gressner O.A., Weiskirchen R., Gressner A.M. Biomarkers of hepatic fibrosis, fibrogenesis and genetic pre-disposition pending between fiction and reality. J Cell Mol Med. 2007;11:1031–1051. - PMC - PubMed

MeSH terms