. 2025 May 31;16(1):5067.
doi: 10.1038/s41467-025-60175-9.

varVAMP: degenerate primer design for tiled full genome sequencing and qPCR

Affiliations

varVAMP: degenerate primer design for tiled full genome sequencing and qPCR

Jonas Fuchs et al. Nat Commun. .

Abstract

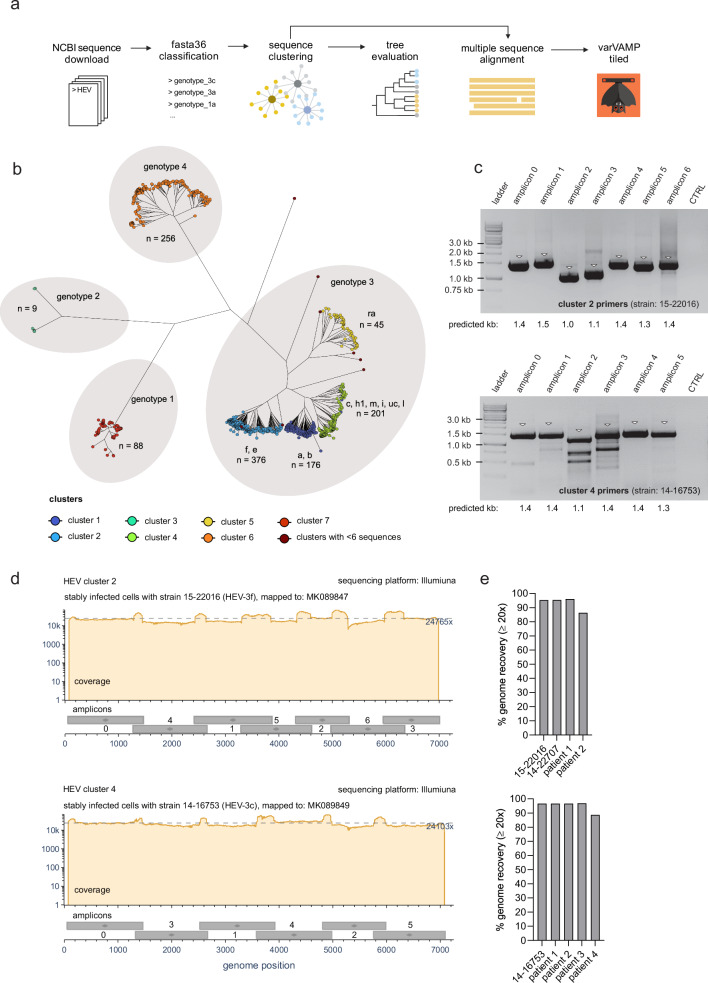
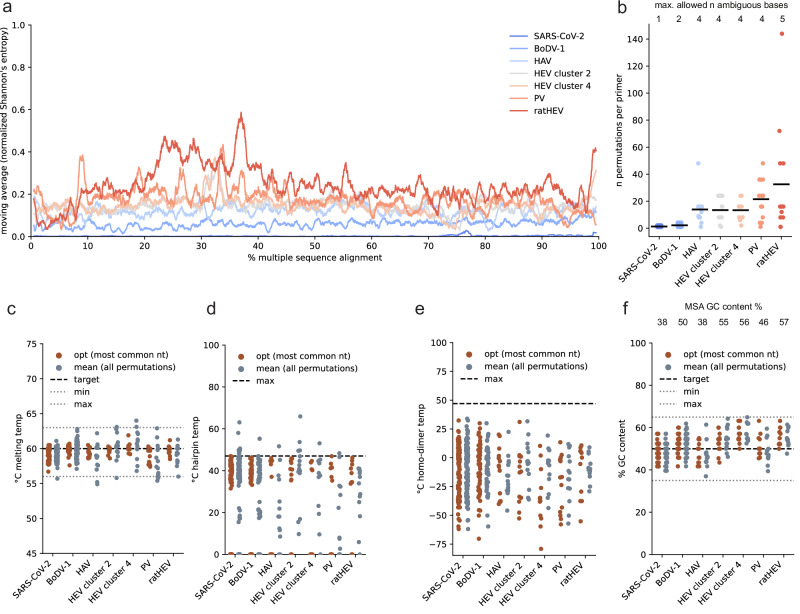
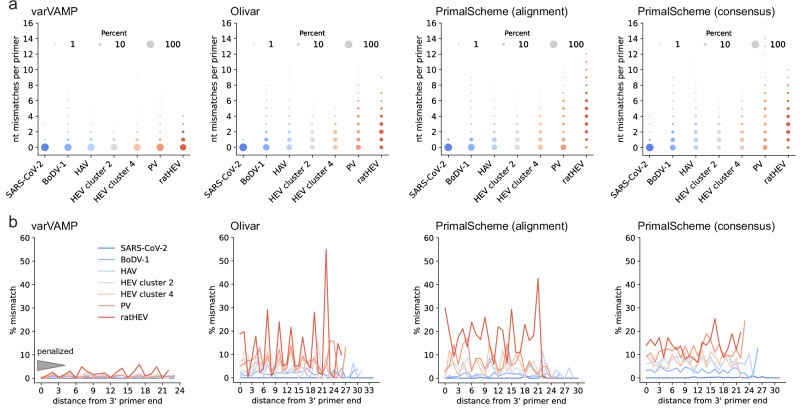
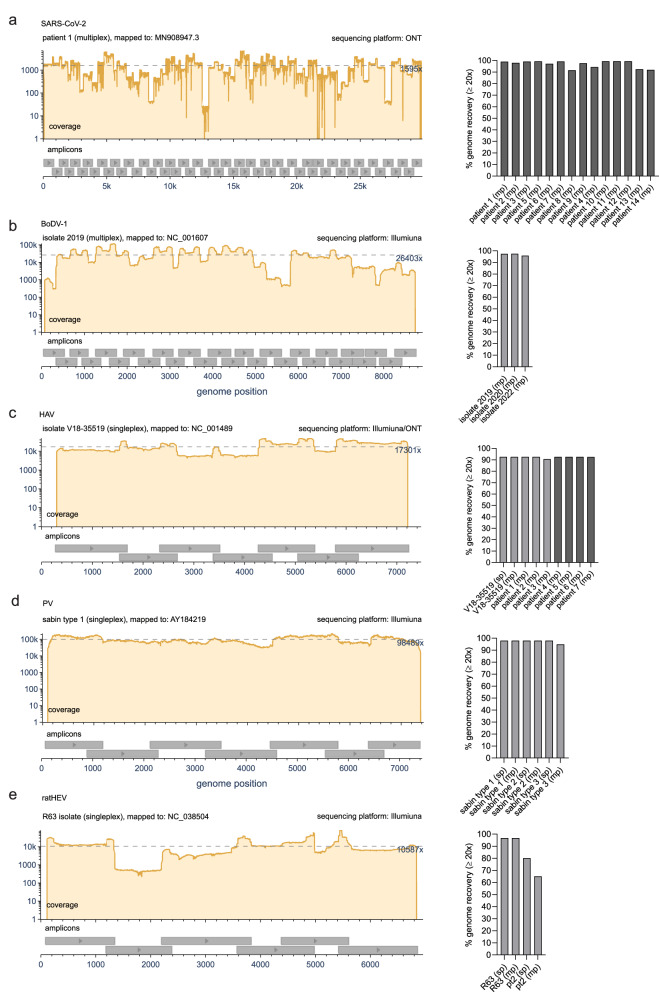
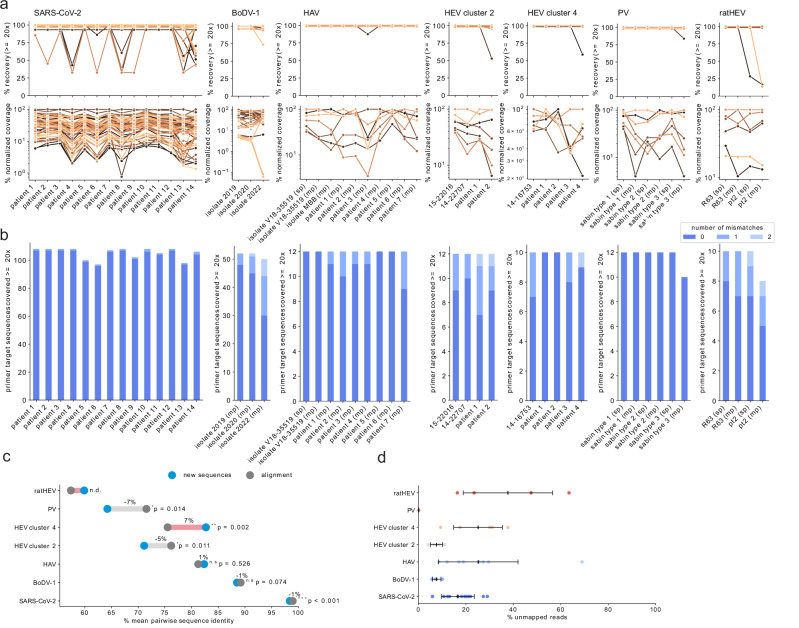
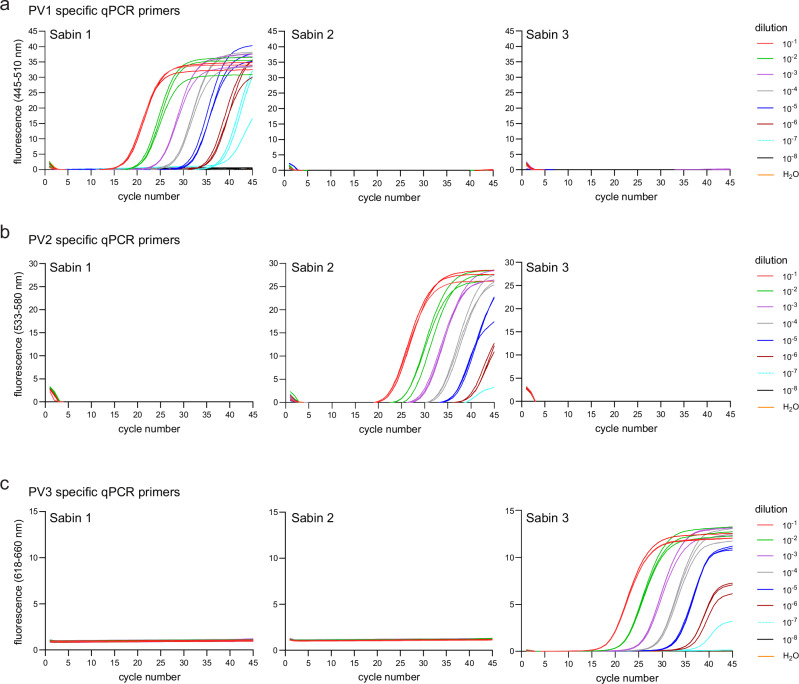
Time- and cost-saving surveillance of viral pathogens is achieved by tiled sequencing in which a viral genome is amplified in overlapping PCR amplicons and qPCR. However, designing pan-specific primers for viral pathogens with high genomic variability represents a significant challenge. Here, we present a bioinformatics command-line tool, called varVAMP (variable virus amplicons), which addresses this issue. It relies on multiple sequence alignments of highly variable virus sequences and enables degenerate primer design for qPCR or tiled amplicon whole genome sequencing. We demonstrate the utility of varVAMP by designing and evaluating novel pan-specific primer schemes suitable for sequencing the genomes of SARS-CoV-2, Hepatitis E virus, rat Hepatitis E virus, Hepatitis A virus, Borna-disease-virus-1, and Poliovirus using clinical samples. Importantly, we also designed primers on the same input data using the software packages PrimalScheme and Olivar and showed that varVAMP minimizes primer mismatches most efficiently. Finally, we established highly sensitive and specific Poliovirus qPCR assays that could potentially simplify current Poliovirus surveillance. varVAMP is open-source and available through PyPI, UseGalaxy, Bioconda, and https://github.com/jonas-fuchs/varVAMP .


Conflict of interest statement

Competing interests: The authors declare no competing interests.

Figures

Fig. 1
Fig. 1. Schematic overview of the varVAMP workflow and example output.
a Overview of the varVAMP workflow. The white boxes represent steps of the pipeline that are common to all modes. The consecutive steps are connected by arrows, and the optional steps are indicated with a dotted border. Colored boxes mark unique steps for each varVAMP mode (blue—single, orange—tiled, green—qPCR). Steps that produce outputs end in schematic folder icons for the main output and the additional data subfolder. (n number, nt nucleotide). Created in BioRender. Fuchs (2025) https://BioRender.com/2l4hzpe. b Example overview plot that is produced when running varVAMP. This plot was generated with varVAMP tiled mode on the example MSA of HEV-3 sequences provided as example data within the varVAMP github repository. The normalized Shannon’s entropy for each alignment position (gray) and its rolling average over 10 nucleotides (black curve) are shown. The orange boxes below the plot mark the start and stop MSA positions of potential primer regions (regions that have, in this case, a maximum of 4 ambiguous bases within the minimal primer length of 19) and the gray and light gray boxes mark all considered forward and reverse primers, respectively. The final scheme that was selected by the graph search for overlapping amplicons (blue) with low-penalty primers (red) is depicted at the bottom.
Fig. 2
Fig. 2. Primer design and tiled sequencing of HEV-3.
a Schematic overview of the data preparation steps preceding primer design. All full-length sequences of HEVs were downloaded from NCBI, sub-genotyped with fasta36 and clustered by similarity with vsearch. The clustering result was evaluated via phylogenetic tree construction. Clusters comprising multiple subgenotypes were aligned with MAFFT, and the MSA used as the input for varVAMP. Created in BioRender. Fuchs (2025) https://BioRender.com/csajk3b. b Phylogenetic tree of full-length HEV sequences constructed with IQ-TREE 2 (GTR + F + R10, 1000 bootstrap replicates). The vsearch clustering result for each sequence is displayed in colors and the HEV genotypes and subgenotypes are indicated at the respective branches (n number of sequences). c Agarose electrophoresis images of the individual PCR products for the cluster 2 (upper plot, representative plot out of 4 plots) and cluster 4 (lower plot, representative plot out of 5 plots) primer schemes tested with the supernatants of HEV-3 f or HEV-3 c stably infected PLC/PRF/5 cells, respectively. Triangles indicate bands at the expected molecular weight of the PCR products (kb kilobases). d Coverage plots of the Illumina sequencing results of the in c amplified PCR products for cluster 2 (upper plot) and cluster 4 (lower plot) mapped to their respective NCBI reference sequences MK089847 and MK089849. Below each coverage plot, the genomic start and stop positions of each amplicon are displayed as gray boxes with their respective amplicon number. Dotted lines indicate mean coverages. Coverage plots were created with BAMdash (individual coverage plots are given in Supplementary Fig. 2). e Genome recovery of HEV-3 persistently infected cell cultures and sub-genotyped HEV-3 positive blood samples subjected to their respective tiled amplicon workflow for cluster 2 (upper plot) or cluster 4 (lower plot). Genome recovery was calculated as the percentage of reference nucleotides covered at least 20 fold. All PCRs were performed in the singleplex setting.
Fig. 3
Fig. 3. In silico evaluation of novel tiled primer schemes for SARS-CoV-2, BoDV-1, HAV, HEV, PV and ratHEV.
a Normalized Shannon’s entropy (1% rolling average) of the MSA used as the varVAMP input. b Number of permutations (degeneracy) of each primer in the tiled sequencing scheme for the respective viruses. Each dot shows the degeneracy of a single primer in the respective schemes (see Table 1). The horizontal lines indicate the means. (n number) Primer melting temperatures (c), hairpin temperatures (d), homo-dimer temperatures (e) and the GC content (f) were calculated either for the primer sequence including the most common nucleotides or averaged over all permutations of the final primer sequences that includes degenerate nucleotides. e, f were calculated with primer3. Each dot represents a single primer of the respective tiled schemes. The dotted lines indicate the upper target cutoffs or target ranges employed by varVAMP (nt nucleotide).
Fig. 4
Fig. 4. Head-to-head benchmark of the variant awareness of varVAMP, Olivar and PrimalScheme.
a Cumulative counts of mismatches between primers and sequences in the MSA. For each primer the number of mismatches with each sequence of the MSA was counted if it was not covered by any primer permutation. Shown are the cumulative mismatches between primers and MSA sequences in the tiled primer schemes for the respective viruses. The dot area size is proportional to the percentage. b Analogous to a the mismatches with the MSA sequences were counted per primer nucleotide position and averaged over all primers in a scheme. As primers vary in their length, the % mismatches are displayed starting at the primer’s 3’ end (position 0 is the most 3’ nucleotide position). The gray triangle schematically indicates the primer positions that varVAMP penalizes and the position-specific penalty multipliers (32, 16, 8, 4, 2).
Fig. 5
Fig. 5. Whole genome sequencing of SARS-CoV-2, BoDV-1, HAV, PV and ratHEV.
Representative coverage plots (left) and % genome recovery (right) of the different a SARS-CoV-2, b BoDV-1, c HAV, d PV and e ratHEV samples subjected to their respective tiled amplicon whole genome sequencing workflows. Coverage plots were created with BAMdash. The dotted lines indicate the mean coverages. The reference genomes used for mapping are indicated in the header of the coverage plots (individual coverage plots are given in Supplementary Fig. 2). Genome recovery was calculated as the precentage of reference nucleotides covered at least 20 fold (sp single plex, mp multiplex). Dark gray bars—ONT generated data, light gray bars—Illumina generated data.
Fig. 6
Fig. 6. Amplicon performance and mismatch analysis.
a For each sequencing result obtained via the virus specific primer scheme, the amplicon recovery (upper panel) and normalized coverage (lower panel) were calculated. Each color represents an individual amplicon for the respective schemes (see Table 1) tracked over different samples that are indicated on the x-axis. Amplicon recovery was calculated as the percentage of reference nucleotides covered at least 20-fold between the genomic start and stop position of the individual amplicons. For the normalized amplicon coverage, the mean coverage was calculated for each amplicon and normalized to the highest covered amplicon of each scheme (set to 100). b For each sequencing result, each primer binding region was analyzed for the number of mismatches not covered by any permutation of the corresponding primer sequence. Mutations were considered only if their variant frequency was ≥0.7. The primers were excluded from the analysis if any primer binding position was not covered at least 20-fold. c Dumbbell plot showing the pairwise identities of the newly generated fasta consensus sequences (blue dots) or the sequences of the varVAMP input MSA (dark gray dots) of each respective primer scheme. Light gray and red lines indicate the percent pairwise identity increase or decrease, respectively. Significance was calculated with a two-sided Welch’s t-test between the pairwise identities of newly produced sequences and alignment sequences for each respective virus. Exact p values are given above the minimum significance threshold of 0.001. (n.d. not determined as n < 3, n.s. not significant, *p ≤ 0.05, **p ≤ 0.01, ***p ≤ 0.001). d Percentage of off-target, unmapped reads for the respective schemes and samples (SARS-CoV-2: n = 14, BoDV-1: n = 3, HAV: n = 9, HEV cluster 2: n = 4, HEV cluster 4: n = 5, PV: n = 6, ratHEV: n = 4). Shown are mean ± STD.
Fig. 7
Fig. 7. Specificity and sensitivity of the novel PV qPCR schemes.
qPCR primers specific for a PV1, b PV2 and c PV3 were tested on serial RNA dilutions extracted from the viral supernatants of Sabin 1, Sabin 2 and Sabin 3 infected cell cultures (n = 3). The fluorescence was measured during the extension step with three different channel setups with respect to the probe fluorophore (FAM = 465–510 nm, JOE = 533–580 nm, CY5 = 618–660 nm). Amplification curves were analyzed using the Roche LightCycler 480 II device software.

References

    1. Gire, S. K. et al. Genomic surveillance elucidates Ebola virus origin and transmission during the 2014 outbreak. Science345, 1369–1372 (2014). - PMC - PubMed
    1. Schemmerer, M., Wenzel, J. J., Stark, K. & Faber, M. Molecular epidemiology and genotype-specific disease severity of hepatitis E virus infections in Germany, 2010–2019. Emerg. Microbes Infect.11, 1754–1763 (2022). - PMC - PubMed
    1. Metsky, H. C. et al. Zika virus evolution and spread in the Americas. Nature546, 411–415 (2017). - PMC - PubMed
    1. Simner, P. J., Miller, S. & Carroll, K. C. Understanding the promises and hurdles of metagenomic next-generation sequencing as a diagnostic tool for infectious diseases. Clin. Infect. Dis.66, 778–788 (2018). - PMC - PubMed
    1. Jaki, L. et al. Total escape of SARS-CoV-2 from dual monoclonal antibody therapy in an immunocompromised patient. Nat. Commun.14, 1999 (2023). - PMC - PubMed

LinkOut - more resources