. 2025 May 31;16(1):5066.
doi: 10.1038/s41467-025-60279-2.

The HP1 box of KAP1 organizes HP1α for silencing of endogenous retroviral elements in embryonic stem cells

Affiliations

The HP1 box of KAP1 organizes HP1α for silencing of endogenous retroviral elements in embryonic stem cells

Nitika Gaurav et al. Nat Commun. .

Abstract

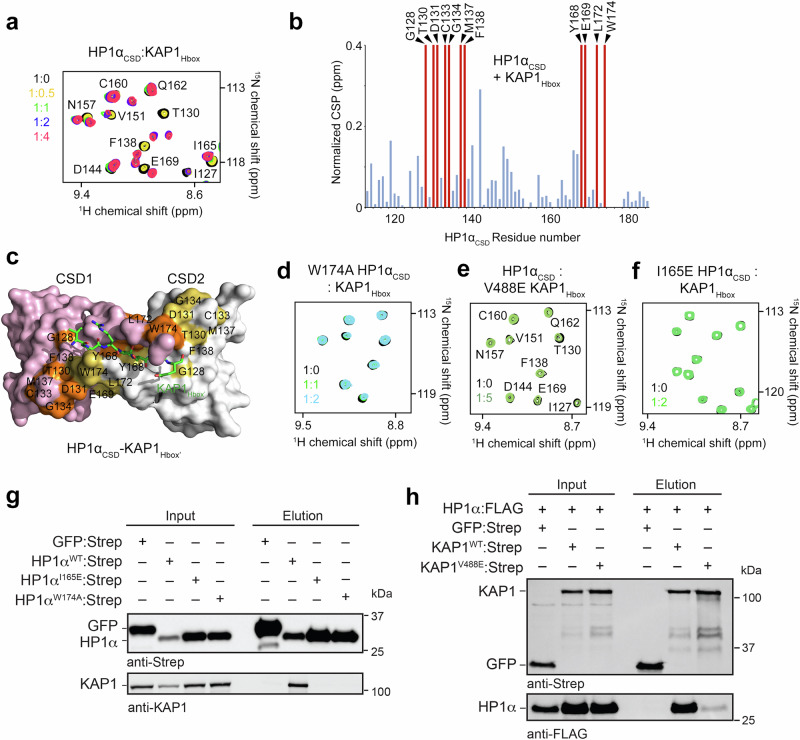
Repression of endogenous retroviral elements (ERVs) is facilitated by KAP1 (KRAB-associated protein 1)-containing complexes, however the underlying mechanism remains unclear. Here, we show that binding of KAP1 to the major component of the heterochromatin spreading and maintenance network, HP1α, plays a critical role in silencing of repetitive elements. Structural, biochemical and mutagenesis studies demonstrate that the association of the HP1 box of KAP1 (KAP1Hbox) with the chromoshadow domain of HP1α (HP1αCSD) leads to a symmetrical arrangement of HP1αCSD and multimerization that may promote the closed state of chromatin. The formation of the KAP1Hbox-HP1αCSD complex enhances charge driven DNA binding and phase separation activities of HP1α. ChIP-seq and ATAC-seq analyses using KAP1 knock out mouse embryonic stem cells expressing wild type KAP1 or HP1-deficient KAP1 mutant show that in vivo, KAP1 engagement with HP1 is required for maintaining inaccessible chromatin at ERVs. Our findings provide mechanistic and functional insights that further our understanding of how ERVs are silenced.


Conflict of interest statement

Competing interests: The authors declare no competing interests.

Figures

Fig. 1
Fig. 1. KAP1 and HP1 are enriched at endogenous retroelements in mouse embryonic stem cells.
ac Correlation plots between HP1 proteins genome-wide at 5 kb bins in ESCs. Spearman correlation tests were used to determine statistical significance. Correlation plots between KAP1 and (d) HP1α, (e) HP1β and (f) HP1γ genome-wide at 5 kb bins in ESCs. Spearman correlation tests were used to determine statistical significance. g ChIP-seq enrichment of heterochromatic histone modifications and factors, including HP1 proteins, mapped to the repetitive genome. Data are represented in a hierarchically (Spearman rank) clustered heatmap of z-score fold enrichment (red) or depletion (blue) over a matched input. See Supplementary Fig. 1 for complete heatmap. h Genome browser representations of enrichment of heterochromatic histone modifications and factors, including HP1 proteins, in ESCs at IAPEz (left), MERVK10C (center) and ETn (right). The y-axis represents read density in counts per million mapped reads (CPM). Average profiles (top) and heatmaps (bottom) of KAP1, HP1α, HP1β and HP1γ enrichment at (i) IAPEz (n = 2,438), (j) MERVK10C (n = 2,074) and (k) ETn (n = 1,116) in ESCs. Data are centered on the LTR with 1.5 kb upstream and 8 kb downstream of the LTR displayed for each analysis.
Fig. 2
Fig. 2. Structural basis for the interaction of KAP1Hbox with HP1αCSD.
a Domain architecture of HP1α: nte amino-terminal extension, CD chromodomain, CSD chromoshadow domain, cte carboxyl-terminal extension. Histone H3K9me2/3 mark recognized by CD is depicted as purple circle. b Binding curves used to determine binding affinity of HP1αCSD for the KAP1Hbox peptide by tryptophan fluorescence. Kd is represented as average ±SD of three independent experiments. n = 3. c The crystal structure of the HP1αCSD dimer in complex with KAP1Hbox’ is depicted as a ribbon diagram with one chromoshadow domain protomer labeled as CSD1 and colored pink and another protomer labeled as CSD2 and colored grey. Bound KAP1Hbox’ is shown as a green ribbon that pairs with the C-terminal parts of CSD1 in a parallel manner and CSD2 in an antiparallel manner (both are in an extended conformation). d A schematic representation of the HP1αCSD dimer in complex with KAP1Hbox. e Surface representation of the HP1αCSD-KAP1Hbox’ complex colored as in (c). KAP1Hbox’ is shown as green stick. Residues of KAP1Hbox’ involved in the interaction with HP1αCSD are labeled. f Close-up view of the KAP1Hbox’-binding site of the HP1αCSD dimer. Residues involved in the interaction between HP1αCSD and KAP1Hbox’ are labeled. Dashed lines represent hydrogen bonds. Source data are provided as a Source Data file.
Fig. 3
Fig. 3. Mapping the KAP1Hbox-HP1αCSD binding interface.
a Overlayed 1H,15N HSQC spectra of 15N-labeled HP1αCSD recorded in the presence of increasing amount of KAP1Hbox peptide. Spectra are color coded according to the protein:peptide molar ratio. b Bar plot of normalized CSPs in 1H,15N HSQC spectra of 15N-labeled HP1αCSD induced by the fourfold molar excess of KAP1Hbox peptide. Disappeared peaks are indicated by red bars and labeled. c Surface representation of the HP1αCSD-KAP1Hbox’ complex, colored as in Fig. 2c. KAP1Hbox’ is shown as green stick. The residues of HP1αCSD, resonances of which disappear in (b) are mapped onto the surface, colored orange and yellow and labeled. d Overlayed 1H,15N HSQC spectra of the 15N-labeled W174A mutant of HP1αCSD recorded in the presence of increasing amount of wild type KAP1Hbox peptide. e Overlayed 1H,15N HSQC spectra of 15N-labeled HP1αCSD recorded in the presence of the V488E mutant of KAP1Hbox peptide. Spectra are color coded according to the protein:peptide molar ratio. f Overlayed 1H,15N HSQC spectra of the 15N-labeled I165E mutant of HP1αCSD recorded in the presence of increasing amount of KAP1Hbox peptide and color coded according to the protein:peptide molar ratio. Western blot analysis of pull-down assays with Strep-tagged wild type and mutated HP1α (g) and Strep-tagged wild type and mutated KAP1 with FLAG-tagged HP1α constructs (h). controls: Strep-tagged GFP. The data are representative of 3 biological replicates with identical results. n = 3 Source data are provided as a Source Data file.
Fig. 4
Fig. 4. KAP1Hbox enhances the phase separation and DNA binding abilities of HP1α.
a EMSA of 147 bp Widom 601 DNA (DNA147) in the presence of increasing amounts of HP1α with (top) and without (bottom) tenfold molar excess of KAP1Hbox. DNA:protein ratio is shown below the gel images. b EMSA of DNA147 in the presence of increasing amounts of HP1α with tenfold molar excess of indicated modified KAP1Hbox. c Immunofluorescence images show the cellular distribution of GFP-KAP1 and endogenous HP1α in KAP1−/− ESCs stably expressing GFP-KAP1RF or GFP-KAP1FR-PVLmut stained with an anti-HP1α antibody (red). DNA was counterstained using DAPI (blue). Scale bar: 10 µm. d Half-FRAP recovery curves for HP1α in GFP+ (green) or GFP-KAP1FR+ (purple) ESCs for 8–12 heterochromatin compartments. The bleach half recovery is indicated by thin lines, and a Savitzky-Golay fit was performed to show the recovery of the non-bleached half and calculate the dip (thick lines). The non-bleached data points represent average ±SEM between 8 and 12 measurements. n > 8 The gray area indicates the range of dip depths in the non-bleached half that correspond to LLPS. e Representative confocal images of DNA-induced HP1α phase separated droplets in the presence of GFP-KAP1FR wild type (green) or GFP-KAP1FR-PVLmut (green) and 647 N labeled HP1α (red). DIC, Differential interference contrast. Scale bar: 5 µm. f The box plot displays the fluorescence of 647 N labeled HP1α within phase-separated droplets. Center lines show the medians; box limits indicate the 25th and 75th percentiles as determined by R software; whiskers extend 1.5 times the interquartile range from the 25th and 75th percentiles. n = 169 (wild type GFP-KAP1FR), 175 (GFP-KAP1FR-PVLmut). Statistical analysis was performed by a two-sided Student’s t test, p-value is indicated. Source data are provided as a Source Data file.
Fig. 5
Fig. 5. HP1α oligomerizes through HP1αCSD.
a Overlayed 1H,15N HSQC spectra of 15N-labeled FL HP1α collected in the presence of increasing amounts of KAP1Hbox peptide. Spectra are color coded according to the protein:peptide molar ratio. HP1αCSD signals in FL HP1α are broadened beyond detection, indicating that the size of this part of HP1α becomes too large, i.e. HP1αCSD multimerization (higher order than detectable dimerization) reduces tumbling rate. b Superimposed 1H,15N HSQC spectra of 15N-labeled FL HP1α (black) and HP1αCSD (pink). c Molecular mass distribution histograms of FL WT and L139E/L150E HP1α at indicated concentrations in mass photometry assay. Maxima of the fits are labeled (kDa). d Overlayed 1H,15N HSQC spectra of 15N-labeled I165E HP1αCSD collected in the presence of increasing amounts of unlabeled WT HP1αCSD. Spectra are color coded according to the molar ratio of CSDs. e The crystal structure of the apo-state of HP1αCSD is depicted in a ribbon diagram (two dimers form an asymmetric unit, see Supplementary Fig. 9a). Two protomers of one HP1αCSD dimer (CSD1 and CSD2) are colored wheat and grey, and both protomers of the neighboring dimer are colored yellow. The dimers interact through their β-sheets. f A close view of the β-sheet binding interface, with the residues involved in the contact shown as sticks and labeled. Dashed lines represent hydrogen bonds. g Bar plot of resonance changes in 1H,15N HSQC spectra of 15N-labeled HP1αCSD’ induced by the 20-fold molar excess of unlabeled HP1αCSD’. h Most perturbed in (g) residues are mapped on the structure of the apo-HP1αCSD, colored blue and labeled. i Superimposed 1H,15N HSQC spectra of 15N-labeled FL L139E/L150E HP1α (black) and L139E/L150E HP1αCSD (light green). j Molecular mass distribution histograms of FL WT and L139E/L150E HP1α in the presence of KAP1Hbox at indicated concentrations in mass photometry assays. Maxima of the fits are labeled (kDa). k Overlayed 1H,15N HSQC spectra of 15N-labeled L139E/L150E HP1αCSD recorded in the presence of increasing amounts of KAP1Hbox peptide. Spectra are color coded according to the protein:peptide molar ratio.
Fig. 6
Fig. 6. Binding of KAP1Hbox’ leads to a symmetric arrangement of HP1αCSD.
a Overlayed structures of HP1αCSD (pink) in complex with KAP1Hbox’ (green) and of apo-state of HP1αCSD (yellow). CSD1 and CSD2 protomers but not the neighboring dimers can be superimposed. Only one protomer from each neighboring dimer (labeled as CSD) is shown for clarity. b A ribbon diagram of the HP1αCSD-KAP1Hbox’ complex. The protomers of a dimer (CSD1 and CSD2), the protomers of the neighboring dimers (CSD), the α-helix interface, and the β-sheet interfaces are labeled. Only one protomer from each neighboring dimer is shown for clarity. c A model of the structural reorganization of HP1αCSD upon binding of KAP1Hbox. d MD simulation analysis of structural stability of HP1αCSD. Kernel Density Estimation (KDE) plots showing the distribution of distances η and ζ between the center of mass of the first monomeric unit and the Cα atoms of residues 123 and 136 at the α-helix and β-sheet interfaces in HP1αCSD without and with KAP1Hbox. e Structural organization of the multimer of the HP1αCSD-KAP1Hbox’ complex. The positively charged side chain of R487 of KAP1Hbox’, shown as a green stick, is oriented toward the inner side of the spiral. f Theoretical molecular masses of indicated proteins and complexes. g Molecular mass distribution histogram of the 1:1 mixture of FL HP1α and FL KAP1 in mass photometry assay. Maxima of the fits are labeled (kDa). Molecular mass distribution histograms of FL HP1α (h) and FL KAP1 (i) in mass photometry assay. Maxima of the fit are labeled (kDa). Source data are provided as a Source Data file.
Fig. 7
Fig. 7. The direct HP1-KAP1 interaction contributes to inaccessible chromatin at ERVs in ESCs.
a Immunoblot of whole cell lysates from Kap1fl/fl;Cre-ERT2 ESCs expressing either exogenous KAP1 or a KAP1 V488E mutant under control of a tetracycline response element. ESCs were treated with either DMSO or 2 μg/mL doxycycline for 48 h followed by treatment with EtOH or 2 μM 4-Hydroxytamoxifen for 48 h. n = 3 with identical results. b Genome browser representations of H3K9me3 and H3K27ac CUT&Tag in WT and KAP1 cKO ESCs as well as ATAC-seq in WT and KAP1 cKO ESCs and KAP1 cKO ESCs expressing exogenous KAP1 or a KAP1 V488E mutant at representative ERVs. The y axis represents read density in counts per million (CPM) mapped reads for an experiment performed in triplicate. ce Heatmaps of KAP1 enrichment, the relative H3K9me3 and H3K27ac CUT&Tag enrichment difference between WT and KAP1 cKO, and the relative ATAC-seq enrichment difference between KAP1 cKO ESCs expressing either WT or KAP1 V488E at c IAPEz (n = 2438), d MERVK10C (n = 2074), and e ETn (n = 1166) ERVs. fh ATAC-seq average profiles in WT and KAP1 cKO ESCs and KAP1 cKO ESCs expressing exogenous KAP1 or a KAP1 V488E mutant at LTRs of f IAPEz n = 2438, p = 0.0004), g MERVK10C (n = 2074, p = 7.94 × 10−12) and h ETn (n = 1166, p = 0.0003)). LTRs were either orphan or adjacent to full-length elements as defined in the methods. Significance determined by Wilcoxon rank sum with BH correction. ik Correlation plots between differential ATAC-seq signal in KAP1 cKO ESCs expressing either WT or KAP1 V488E compared to KAP1 ChIP-seq (left), differential H3K9me3 CUT&Tag in KAP1 cKO compared to WT ESCs (middle), and differential H3K27ac CUT&Tag in KAP1 cKO compared to WT ESCs (left) at i IAPEz (n = 2438), j MERVK10C (n = 2074), and k ETn (n = 1166). Spearman correlation tests were used to determine statistical significance. Source data are provided as a Source Data file.

References

    1. Janssen, A., Colmenares, S. U. & Karpen, G. H. Heterochromatin: Guardian of the Genome. Annu Rev. Cell Dev. Biol.34, 265–288 (2018). - PubMed
    1. Rowe, H. M. & Trono, D. Dynamic control of endogenous retroviruses during development. Virology411, 273–287 (2011). - PubMed
    1. Copley, K. E. & Shorter, J. Repetitive elements in aging and neurodegeneration. Trends Genet39, 381–400 (2023). - PMC - PubMed
    1. Jansz, N. & Faulkner, G. J. Endogenous retroviruses in the origins and treatment of cancer. Genome Biol.22, 147 (2021). - PMC - PubMed
    1. Bannister, A. J. et al. Selective recognition of methylated lysine 9 on histone H3 by the HP1 chromo domain. Nature410, 120–124 (2001). - PubMed

MeSH terms