. 2025 May 31;16(1):5081.
doi: 10.1038/s41467-025-60405-0.

Multi-trait genetic analysis of asthma and eosinophils uncovers pleiotropic loci in East Asians

Affiliations

Multi-trait genetic analysis of asthma and eosinophils uncovers pleiotropic loci in East Asians

Lili Zhi et al. Nat Commun. .

Abstract

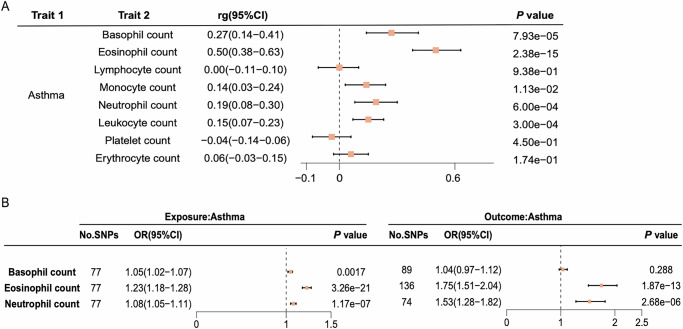
Asthma is a prevalent respiratory condition with over 100 genetic loci identified through genome-wide association studies (GWAS). However, the genetic basis of asthma in East Asians remains underexplored. To address this, we performed a comprehensive analysis of shared genetic mechanisms between asthma and white blood cell (WBC) traits in East Asians, aiming to identify potential pleiotropic loci. Using linkage disequilibrium score regression (LDSC), we identified a significant genetic correlation between asthma and eosinophil count, further supported by Mendelian randomization (MR) analysis. A multi-trait analysis of GWAS (MTAG) uncovered 52 genome-wide significant loci, including 31 previously unreported loci specific to East Asians. Notably, we discovered a missense variant (rs75326924) in the CD36 gene that exhibits increased expression in lymphocytes and type 2 innate lymphoid cell (ILC2)-enriched cells in asthma patients, confirmed by flow cytometry. Proteomic profiling demonstrated downregulation of immune-related proteins such as Interleukin-7, Oncostatin M, and VEGFA in carriers of rs75326924, a variant previously associated with CD36 deficiency. Our findings provide insights into genetic loci and candidate genes underlying asthma in East Asians, offering potential targets for therapeutic interventions tailored to this population.


Conflict of interest statement

Competing interests: The authors declare no competing interests.

Figures

Fig. 1
Fig. 1. Overview of study design and analysis workflow.
The figure illustrates the multi-trait analysis pipeline used to identify genetic loci associated with asthma and eosinophil traits in East Asians. Key steps include genetic correlation analysis, Mendelian randomization, and validation of findings through multi-omics data and replication cohorts.
Fig. 2
Fig. 2. Genetic correlation and bi-directional causal relationship between Asthma and hematological traits.
A Global genetic correlations between asthma and hematological traits estimated using LD score regression based on GWAS summary statistics. Squares represent the point estimates of genetic correlation (rg), and horizontal error bars represent 95% confidence intervals (CI). Error bars indicate 95% CI, and the center corresponds to the estimated rg value. Sample sizes: Asthma (GBMI): 341,204 (18,549 cases, 322,655 controls); Basophil count: 81,042; Eosinophil count: 86,890; Lymphocyte count: 89,266; Monocyte count: 88,929; Neutrophil count: 78,744; Leukocyte count: 151,807; Platelet count: 145,648; Erythrocyte count: 150,708. All GWAS were conducted in East Asian populations. B Bi-directional causal relationships between asthma and hematological traits, assessed using two-sample Mendelian randomization (MR). The left panel shows the causal effect of asthma (exposure) on hematological traits (outcomes); the right panel shows the reverse. Each point represents the odds ratio (OR), and horizontal error bars represent the 95% CI. Error bars indicate 95% CI, and the center corresponds to the estimated OR value. No. SNPs: number of instrumental variants used in the MR analysis. Genetic correlation analyses in panel (A) were conducted using LD score regression with two-sided P-values. Bi-directional Mendelian randomization in panel (B) was performed using the inverse-variance weighted (IVW) method, also using two-sided tests. No multiple testing correction was applied to P-values shown, as results are interpreted in the context of a hypothesis-driven analysis of selected traits. Source data are provided as a Source Data file.
Fig. 3
Fig. 3. Circular Manhattan plot of significant loci associated with asthma in East Asian populations.
Circular plot illustrating pleiotropic loci shared between asthma and eosinophil traits across the genome. The outermost ring represents human chromosomes (chr1 to chr22), while the subsequent inner rings display significant associations from MTAG-GBMI, MTAG-BBJ, Asthma-GBMI, Asthma-BBJ, and eosinophils. Newly identified loci are highlighted in red, and previously known loci are shown in black. MTAG-GBMI: Multi-trait analysis of GWAS applied to asthma data from the Global Biobank Meta-analysis Initiative (GBMI). This combines asthma and eosinophil GWAS data to identify shared loci. MTAG-BBJ: MTAG analysis using asthma data from BioBank Japan (BBJ) alongside eosinophil GWAS data. Asthma-GBMI: Single-trait GWAS results for asthma from GBMI. Asthma-BBJ: Single-trait GWAS results for asthma from BBJ. Eosinophils: Single-trait GWAS results for eosinophil counts. Source data are provided as a Source Data file.
Fig. 4
Fig. 4. Elevated CD36 Expression in the Peripheral Blood of Asthma Patients.
A Flow cytometry was used to detect the proportion of granulocytes, monocytes, and lymphocytes, as well as the expression of CD36 and CRTH2 in peripheral blood samples from asthmatic and healthy individuals. B Quantification of the proportion of granulocytes (P = 0.4076), monocytes (P = 0.1499), and ILC2-enriched (CD4- CRTH2+) cells (P = 0.0415) in asthma patients and controls. C Quantification of CD36+ cell percentages in granulocytes (P = 0.1114), monocytes (P = 0.1230), and lymphocytes (P = 0.0063), as well as the mean fluorescence intensity (MFI) of CD36 in CD4- CRTH2+ cells (P = 0.0147). Flow cytometric analysis was performed on peripheral blood immune cells from 22 asthmatic patients and 23 healthy non-allergic volunteers. Data are presented as mean ± standard deviation (SD). Error bars indicate SD. Statistical significance was assessed using a two-sided unpaired Student’s t test without correction for multiple comparisons (**P < 0.01; *P < 0.05; ns not significant). Source data are provided as a Source Data file.
Fig. 5
Fig. 5. Odds ratios for asthma by PRS percentiles.
Two different polygenic risk score (PRS) models, PRS-32 and PRS-63, are presented. The x-axis represents PRS quintiles, and the y-axis shows the odds ratios (ORs) for asthma, with 95% confidence intervals (CIs) compared to the lowest PRS group (reference). Error bars represent 95% CI, and the center indicates the estimated OR. The analysis was based on 1100 asthmatic patients and 2506 controls of East Asian ancestry. Source data are provided as a Source Data file.

Similar articles

References

    1. Zhu, Z. et al. A genome-wide cross-trait analysis from UK Biobank highlights the shared genetic architecture of asthma and allergic diseases. Nat. Genet.50, 857–864 (2018). - PMC - PubMed
    1. Tsuo, K. et al. Multi-ancestry meta-analysis of asthma identifies novel associations and highlights the value of increased power and diversity. Cell Genom.2, 100212 (2022). - PMC - PubMed
    1. Turley, P. et al. Multi-trait analysis of genome-wide association summary statistics using MTAG. Nat. Genet.50, 229–237 (2018). - PMC - PubMed
    1. Zhu, Z., Anttila, V., Smoller, J. W. & Lee, P. H. Statistical power and utility of meta-analysis methods for cross-phenotype genome-wide association studies. PLoS One13, e0193256 (2018). - PMC - PubMed
    1. Song, Y. et al. Multitrait genetic analysis identifies novel pleiotropic loci for depression and schizophrenia in East Asians. Schizophr. Bull. 10.1093/schbul/sbae145 (2024). - PMC - PubMed