. 2025 May 31;16(1):5071.
doi: 10.1038/s41467-025-60379-z.

Allosteric amyloid catalysis by coiled coil fibrils

Affiliations

Allosteric amyloid catalysis by coiled coil fibrils

Sisira Mambram Kunnath et al. Nat Commun. .

Abstract

Amyloid-mediated catalysis of key biological reactions has recently attracted significant interest as this phenomenon may portend new functions for physiological and synthetic amyloid proteins. Here, we report an allosteric mechanism of catalytic amyloids, mediated via an unconventional coiled-coil fibril organization, facilitating hydrolysis of β-lactam antibiotics. Specifically, the hydrolysis reaction was catalyzed by a fibrillar peptide comprising alternating lysine/phenylalanine β-sheet-forming sequence. Analysis of peptide variants, simulations, and cryogenic electron microscopy reveal that the β-lactam molecules attach electrostatically to the lysine sidechains on the fibrils' surfaces, generating a double-coiled fibril structure in which the anchored β-lactam molecules are nestled within twisted fibril strands. This organization facilitates the allosteric catalytic process in which hydrolytic β-lactam ring opening is induced via nucleophilic attacks by the lysine sidechains degradation. The allosteric catalytic activity of the phenylalanine/lysine amyloid fibrils highlights the functional versatility of amyloid fibrils and their potential applications in human health and environmental biotechnology.


Conflict of interest statement

Competing interests: The authors declare no competing interests.

Figures

Fig. 1
Fig. 1. PFK amyloid fibrils catalyze hydrolysis of β-lactam antibiotics.
a The experimental scheme. PFK forms amyloid fibrils comprising an antiparallel cross-β architecture (the PFK sequence is shown on the right, highlighting the surface-displayed nucleophilic lysine sidechains). The fibrils’ surface induces catalysis of the β-lactam hydrolytic ring. b Fluorescence emission of PFK (0.2 mM) incubated with the amyloid-sensitive fluorescence dye Amytracker-680 (Ex = 550 nm, Em = 650 nm), as a function of KCl concentration. The inset shows a representative cryo-TEM image of PFK amyloid fibrils upon incubation with 0.2 M KCl. The values are presented as an average ± SEM, and the measurements were repeated three times in independent experiments (n = 3). c Nitrocefin hydrolysis recorded upon incubation with PFK fibrils (PFK concentration 0.2 mM; KCl 0.2 M), and PFK monomers (no KCl added). The concentration of hydrolyzed nitrocefin was determined by measuring the absorbance at 480 nm in the reaction mixture. d PFK amyloid fibril-catalyzed hydrolysis of penicillin and amoxicillin. The substrate molecules were incubated with PFK at pH = 7.4, and the relative abundance of the reactants and hydrolysis products (shown in the chemical reaction schemes) were determined by LC-MS. Solid blue and red curves represent the reactant and product, respectively, following incubation with the PFK amyloid fibrils, while the broken curves correspond to the control experiments (no PFK peptide added). The values are presented as an average ± SEM, and the measurements were repeated four times in independent experiments (n = 4) in the case of amoxicillin and three times in independent experiments (n = 3) in the case of penicillin. Source data are provided as a Source Data file.
Fig. 2
Fig. 2. Catalytic activity of PFK amyloid fibrils in nitrocefin hydrolysis.
The datapoints represent the measured initial rates (V0) extracted from the absorbance curves accounting for nitrocefin hydrolysis. The sigmoidal purple curve corresponds to fitting the entire data set to the Hill equation. The orange line corresponds to fitting only the low nitrocefin concentrations (< 300 µM), showing the quasi-hyperbolic pattern. The catalytic parameters extracted from the two fittings are presented on the right. The measurements were repeated five times in independent experiments (n = 5), and the V0 values are presented as average ± SEM. The catalytic parameters were derived from a nonlinear regression of the Hill equation to the average values, where the errors are the confidence intervals of the fitting. Source data are provided as a Source Data file.
Fig. 3
Fig. 3. Effect of an anti-β-lactamase antibody on PFK amyloid fibrils’-induced nitrocefin hydrolysis.
a Nitrocefin degradation in the presence of PFK fibrils (2 mM) with (orange curve) and without (purple curve) anti-β-lactamase antibody added. Nitrocefin concentration was 0.3 mM. b A box-and-whisker plot depicting the initial nitrocefin hydrolysis reaction rates in the presence of PFK amyloid fibril (2 mM), upon addition of different concentrations of a specific antibody (anti-β-lactamase; orange boxes), and a non-specific polyclonal antibody [HXK I antibody (N-19); gray boxes]. The purple box represents the nitrocefin sample without an antibody added. Data presented in a box-and-whisker plot, with mean line and quartile calculation using inclusive median. The measurements were repeated three times in independent experiments (n = 3) for anti-β-lactamase and five times in independent experiments (n = 5) for HXK I antibody (N-19). Source data are provided as a Source Data file.
Fig. 4
Fig. 4. Structural and catalytic properties of PFK variants.
a Sequences of the peptide variants tested. The hydrophilic residues are marked in red, blue, and green, representing anionic, cationic and uncharged residues, respectively. The formal peptide charges and ζ-potentials of the peptide assemblies (prepared at 0.2 mM, Hepes buffer 50 mM, pH 7.4 supplemented with 0.2 M KCl) are also indicated. b Cryo-TEM images of the peptide assemblies (0.2 mM peptide concentrations, dissolved in Hepes 50 mM pH 7.4, KCl 0.2 M. Bars correspond to 200 nm. c Initial nitrocefin-hydrolysis reaction rates calculated for PFK fibrils (purple curve) and PFR fibrils (orange curve). V0 of the other variants are presented in Supplementary Fig. 7. Peptide concentrations 0.2 mM, dissolved in Hepes 50 mM at pH 7.4, KCl 0.2 M. The values are presented as an average ± SEM, the measurements were repeated five times in independent experiments (n = 5). Source data are provided as a Source Data file. d The catalytic parameters derived from the fitting of the V0 curves for PFK and PFR to the Hill equation. The values in the brackets represent confidence intervals.
Fig. 5
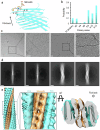
Fig. 5. Structural analysis of the PFK fibril/nitrocefin assembly.
a MD-based snapshot of nitrocefin docking on the surface of a PFK fibril, showing hydrogen bonds between nitrocefin and Lys-10 and Lys-12 displayed on the β-sheets. b Relative probabilities of lysine binding to nitrocefin, extracted from the MD simulations. Source data are provided as a Source Data file. c Cryo-EM micrographs of PFK fibrils (formed in 0.2 M KCl solution) without nitrocefin (left) and following incubation with nitrocefin (0.7 mM; right). Scale bars correspond to 20 nm. The experiment was conducted five times (independent repeats) and included hundreds of pictures per sample. d Representative 2D class averages of PFK amyloid fibrils without (two left images) and after incubation with nitrocefin (right images). Scale bars correspond to 5 nm. e 3D cryo-EM map of PFK fibrils incubated with nitrocefin. Zoomed-in are side (center) and radial (right) views of the manually fitted MD-based model to the 3D cryo-EM map. Images were made with UCSF-chimera and PyMol. For more orientations, see Supplementary Fig. 9. The 3D map is based on 507,432 analyzed particles.
Fig. 6
Fig. 6. PFKDOPA-silica bead constructs employed for hydrolysis and removal of water-soluble β-lactam antibiotics.
a Illustration of a water filtration column containing PFKDOPA grafter silica beads. PFKDOPA. PFKDOPA anchors onto the silica bead surface via the side chain of Lys-12. The SEM image depicts abundant PFKDOPA fibrils attached to the bead’s surface. b Adsorption isotherm of PFKDOPA fibrils on 10 µm silica particles (50 µg/mL particles), determined through the UV-vis absorbance of PFKDOPA in the supernatant, and fitted to the Hill equation using nonlinear regression. The values are presented as an average ± SEM, and the measurements were repeated four times in independent experiments (n = 4). Source data are provided as a Source Data file. c Photographs showing the hydrolysis of nitrocefin using the PFKDOPA-bead column filter. i. A glass column filled with PFKDOPA-silica bead (2 mm bead diameter, coated with 3 mM PFKDOPA). ii. The column immediately after the addition of nitrocefin solution (200 µM nitrocefin in deionized water). iii. The column after six-hour incubation, indicating pronounced hydrolysis of the nitrocefin. iv. Photograph taken following five cycles of nitrocefin addition and washing with deionized water. d UV-vis absorbance spectra of the eluent - fresh nitrocefin (200 µM) prior to injection into the PFKDOPA-silica bead column (black spectrum), the eluate collected from the column (blue spectrum), and nitrocefin solution eluate after passing through a column of silica beads not coated with PFKDOPA fibrils (red spectrum). The inset shows the percentage of nitrocefin degradation following several cycles of nitrocefin addition. e Hydrolysis of penicillin using the PFKDOPA-silica bead column setup. Relative penicillin concentrations in the eluate were determined by LC-MS (the LC-MS chromatograms are presented in Supplementary Fig. 4). Solid blue curves correspond to non-hydrolyzed penicillin, red curves to hydrolyzed penicillin. Broken lines represent control samples using bare silica beads uncoated with PFKDOPA. Each data point represents an average of three independent measurements and is presented as the average ± SD, n = 3. f SEM images of PFKDOPA-silica bead prior to nitrocefin addition (i), and after five cycles of nitrocefin incubation (ii). Scale bars correspond to 200 nm. A diagram showing fibril width distribution before (blue) and after (red) ten nitrocefin incubation. Fibril width distribution was carried out using ImageJ image analysis software, examining 200 fibrils. Source data are provided as a Source Data file.

References

    1. Zozulia, O., Dolan, M. A. & Korendovych, I. V. Catalytic peptide assemblies. Chem. Soc. Rev.47, 3621–3639 (2018). - PMC - PubMed
    1. Arad, E., Yosefi, G., Bitton, R., Rapaport, H. & Jelinek, R. Native glucagon amyloids catalyze key metabolic reactions. ACS Nano16, 12889–12899 (2022). - PubMed
    1. Arad, E., Baruch Leshem, A., Rapaport, H. & Jelinek, R. β-Amyloid fibrils catalyze neurotransmitter degradation. Chem. Catal.1, 908–922 (2021).
    1. Horvath, I., Mohamed, K. A., Kumar, R. & Wittung-Stafshede, P. Amyloids of α-synuclein promote chemical transformations of neuronal cell metabolites. Int. J. Mol. Sci. 24, 10.3390/ijms241612849 (2023). - PMC - PubMed
    1. Wittung-Stafshede, P. Chemical catalysis by biological amyloids. Biochem. Soc. Trans.0, 1–8 (2023). - PMC - PubMed

LinkOut - more resources