. 2025 May 31;16(1):5073.
doi: 10.1038/s41467-025-60402-3.

Endolysosomal processing of neuron-derived signaling lipids regulates autophagy and lipid droplet degradation in astrocytes

Affiliations

Endolysosomal processing of neuron-derived signaling lipids regulates autophagy and lipid droplet degradation in astrocytes

Jagannatham Naidu Bhupana et al. Nat Commun. .

Abstract

Dynamic regulation of metabolic activities in astrocytes is critical to meeting the demands of other brain cells. During neuronal stress, lipids are transferred from neurons to astrocytes, where they are stored in lipid droplets (LDs). However, it is not clear whether and how neuron-derived lipids trigger metabolic adaptation in astrocytes. Here, we uncover an endolysosomal function that mediates neuron-astrocyte transcellular lipid signaling. We identify Tweety homolog 1 (TTYH1) as an astrocyte-enriched endolysosomal protein that facilitates autophagic flux and LD degradation. Astrocyte-specific deletion of mouse Ttyh1 and loss of its Drosophila ortholog lead to brain accumulation of neutral lipids. Computational and experimental evidence suggests that TTYH1 mediates endolysosomal clearance of ceramide 1-phosphate (C1P), a sphingolipid that dampens autophagic flux and LD breakdown in mouse and human astrocytes. Furthermore, neuronal C1P secretion induced by inflammatory cytokine interleukin-1β causes TTYH1-dependent autophagic flux and LD adaptations in astrocytes. These findings reveal a neuron-initiated signaling paradigm that culminates in the regulation of catabolic activities in astrocytes.


Conflict of interest statement

Competing interests: The authors declare no competing interests

Figures

Fig. 1
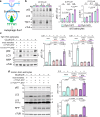
Fig. 1. Ttyh1 localizes to endolysosomes and mediates autophagic flux in astrocytes.
a Ttyh1 is primarily expressed in mouse astrocytes. Representative (n = 2 mouse brains; 16-weeks-old female) immunofluorescence image of a mouse hippocampal sagittal section shows nucleus (lavender), Ttyh1 (magenta), and Gfap (green). Insets show magnification of boxed region. b, c Ttyh1 localizes to endolysosomes in astrocytes. Confocal images of primary mouse cortical astrocytes show nucleus (blue), Ttyh1 (magenta), Lamp1 (green) (c) (n = 4 astrocytes), and LC3 (green) (d) (n = 7 astrocytes). d Schematic representations of mouse Ttyh1flox allele and strategy to delete Ttyh1 in cortical astrocytes isolated from Aldh1l1-cre/ERT2; Ttyh1fl/fl conditional knockout (cKO) mice. e Loss of Ttyh1 leads to accumulation of autophagosome markers upon autophagy induction. Shown are representative immunoblot images and quantifications of autophagosome markers LC3 (three independent experiments) and p62 (four independent experiment) in primary cortical astrocytes of the cKO mice. Treatment with culture medium was used as control. Nutrient deprivation for 2 h in artificial cerebrospinal fluid (ACSF) was used to induce autophagy. Bafilomycin A1 (BafA1; 100 nM) inhibits lysosomal acidification and blocks autophagic flux. High LC3-II/I ratio and normalized p62 levels indicate autophagic flux blockage. Values are normalized to those of the Ttyh1 WT, medium condition, on the same blot. Data were presented as mean ± SEM. Number of biological replicates (n) is shown in brackets at the bottom of each bar. Unpaired two-tailed t-test (LC3-II/I: t = 5.464, df = 4; p62/αTub: t = 2.877, df = 6). f Ttyh1 mediates autophagic flux. Primary cortical astrocytes from the cKO mice expressing autophagic flux probe GFP-LC3-RFP-LC3ΔG were treated with ACSF for 0, 30, and 90 min. The ratio between GFP and RFP fluorescence inversely correlates with autophagic flux. Shown are representative fluorescence images and quantification of the GFP/RFP ratio of individual astrocytes. All GFP/RFP ratios are normalized to the mean of those at 0 min. Each datapoint represents one astrocyte. Data were presented as mean ± SEM. Number of astrocytes (n) is shown in brackets at the bottom of each bar. Unpaired two-tailed t-test (Ttyh1 WT: t = 4.135, df = 44; Ttyh1 KO: t = 1.200, df = 43; n.s not significant, P = 0.2366). Source data are provided as a Source Data file.
Fig. 2
Fig. 2. Ttyh1 mediates endolysosomal clearance of ceramide 1-phosphate (C1P).
a, b Simulated 3-dimensional docking between a human TTYH1 monomer and ceramide 1-phosphate (CerP(d18:1/22:0)). TMD transmembrane domain. Constituent residues of the docking cavity are shown in surface representation. Residues in green were predicted to form hydrophobic interactions with the docked C1P. E210, R213, and Y217 are highlighted in orange. Magnification of the docking region is shown in (b). c Peptide sequence alignment between TTYH1 orthologs of the indicated species. Shown are the partial sequences of the third transmembrane helix. Positions of E210, R213, and Y217 of human TTYH1 are indicated by orange dots. The evolutionarily conserved E210 and R213 are colored in red. d Quantifications of NBD-C1P pulse-chase assay. Ttyh1 WT and Ttyh1 KO astrocytes were pulsed with 2 µM NBD-C1P for 15 min, before chasing in ACSF for 0, 15, 30, and 60 min. NBD fluorescence intensities for each time-point were normalized to the mean of Ttyh1 WT values. Box plots show the median, the bounds of the box (25th and 75th percentiles) and whiskers representing minimum and maximum values. Number of astrocytes (n) from two independent experiments is shown in bracket underneath each box plot. Mann–Whitney test. n.s. not significant, P = 0.379. e E210 and R213 confer C1P clearance function. The two residues in human TTYH1 were substituted with nonpolar alanine to create the TTYH1ER/AA mutant. Astrocytes expressing either wild-type TTYH1 or TTYH1ER/AA mutant were subject to the NBD-C1P pulse-chase assay. Astrocytes were pulsed with 2 µM NBD-C1P for 15 min, followed by chasing for 60 min. Shown are quantifications of NBD fluorescence before and after the chase. Fluorescence intensities were normalized to the mean of the TTYH1-expressing Ttyh1 WT astrocytes values at 0-min chase. Box plots show the median, the bounds of the box (25th and 75th percentiles) and whiskers representing minimum and maximum values. Number of astrocytes (n) from two independent experiments is shown in brackets underneath each box plot. One-way ANOVA (F = 19.3, df = 188) followed by Bonferroni’s multiple comparisons post hoc test. n.s. not significant, P > 0.9999. Source data are provided as a Source Data file.
Fig. 3
Fig. 3. TTYH1 mitigates the inhibitory effect of C1P on autophagic flux.
a Schematic representation of TTYH1-mediated endolysosomal clearance of C1P. b Ttyh1 deficiency exacerbates autophagic flux inhibition by exogenous C1P. Levels of p62 and LC3 in cKO astrocytes in response to exogenous C1P were analyzed. Astrocytes were treated with 0 (0.1% DMSO), 0.1, or 0.5 µM of C1P in 0.1% BSA-supplemented culture media for 2 h. Shown are representative immunoblot images and quantifications of three independent experiments. Values were normalized to those of Ttyh1 WT, 0 µM C1P condition on the same blot. Data were presented as mean ± SEM. Number of biological replicates (n) is shown in brackets at the bottom of each bar. ***P < 0.001, **P < 0.01, One-way ANOVA (p62/αTub: F = 56.91, df =  17; LC3-II/I: F = 42.95, df = 23) followed by Bonferroni’s multiple comparisons post hoc test. c Human TTYH1 rescues C1P-induced autophagic flux blockage in Ttyh1 KO astrocytes. Levels of LC3 and p62 in Ttyh1 KO astrocytes in response to C1P (0.5 µM) were analyzed. Shown are representative immunoblot images and quantifications of four independent experiments. Values were normalized to those of the untreated mock-transfected control on the same blot. Data are presented as mean ± SEM. Number of biological replicates (n) is shown in brackets at the bottom of each bar. One-way ANOVA (p62/αTub: F = 15.43, df = 23; LC3-II/I: F = 40.88, df = 23) followed by Bonferroni’s multiple comparisons post hoc test. n.s. not significant, P > 0.9999. d Overexpression of TTYH1 in astrocytes restores autophagic flux upon C1P. Levels of LC3 and p62 in primary human brain astrocytes in response to C1P (50 µM) were analyzed. Shown are representative immunoblot images and quantifications of four independent experiments. Values were normalized to those of the untreated mock-transfected control on the same blot. Data were presented as mean ± SEM. Number of biological replicates (n) is shown in brackets at the bottom of each bar. One-way ANOVA (p62/αTub: F = 17.98, df = 23; LC3-II/I: F = 117.5, df = 23) followed by Bonferroni’s multiple comparisons post hoc test. n.s. not significant, P > 0.9999. Source data are provided as a Source Data file.
Fig. 4
Fig. 4. Ttyh1 mediates lipid droplet degradation.
a Ttyh1 mediates lipid droplet (LD) breakdown in astrocytes. Triglycerides (TAG) levels in astrocytes were measured at 0 and 120 min after nutrient deprivation. Bafilomycin A1 (BafA1) inhibits lysosome degradation. Relative absorbance values were reported by the colorimetric TAG assay, and are normalized to the mean of Ttyh1 WT values at 0 min. Data were presented as mean ± SEM. Number of independent lipid extracts (n) is shown at the bottom of each bar. Unpaired two-tailed t-test (t = 105.2, df = 4). b, c Drosophila TTYH1 ortholog mediates LD breakdown in glia. Representative confocal images of primary glial cells isolated from wildtype (WT) and tty−/ Drosophila brains in (b) show glial nuclei (nucRFP; magenta) and BODIPY493/503 (BODIPY; green) stained LDs. Quantifications of BODIPY signals in c reveal LD contents in the glial cells. Each datapoint represents one glial cell. Data are presented as mean ± SEM. Number of glial cells (n) from ≥3 primary cell culture is shown in bracket underneath each bar. Mann–Whitney test. d Lipidomic profiles show increased amounts of TAG and DAG species in tty−/− Drosophila heads. Relative fold-changes are shown. Box plots show the median, the bounds of the box (25th and 75th percentiles) and whiskers representing minimum and maximum values. Data were from seven sample cohorts for each genotype; each cohort contained lipid extracts from ≥40 fly heads. Mann–Whitney test. e Astrocyte-specific knockout of Ttyh1 leads to TAG accumulation in mouse cortices. Two-month-old Aldh1l1-cre/ERT2; Ttyh1fl/fl mice were injected with either vehicle or tamoxifen (TAM) for 5 consecutive days. Protein and TAG contents in the dissected cortices were measured. TAG contents were quantitated by enzyme-coupled assay. TAG contents in the cortical tissues of female (n = 3) and male (n = 6) mice were shown separately. [TAG] quantity in each cortical tissue sample was normalized to the respective protein quantity. Box plots show the median, the bounds of the box (25th and 75th percentiles) and whiskers representing minimum and maximum values. Unpaired two-tailed t-test (Female: t = 41.04, df = 4; male: t = 33.33, df = 10). Source data are provided as a Source Data file.
Fig. 5
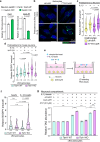
Fig. 5. Ttyh1 prevents C1P-induced lipid droplet accumulation.
a Loss of Ttyh1 sensitizes C1P-induced TAG accumulation in astrocytes. Cellular TAG contents in cKO astrocytes were measured after treatment with 0 (0.1% DMSO), 0.5, or 5 µM of C1P in 0.1% BSA-supplemented culture media for 2 h. Data were presented as mean ±  SEM. Number of independent lipid extracts (n) is shown at the bottom of each bar. One-way ANOVA (F = 581.7; df = 20) followed by Bonferroni’s multiple comparisons post hoc test. b, c Loss of Ttyh1 exacerbates C1P-induced LD buildup in astrocytes. Representative confocal images in (b) show cKO astrocytes stained with BODIPY (green) and DAPI (blue) after indicated treatments. Quantifications of BODIPY signals in (c) reveal LD contents in Ttyh1 WT and KO astrocytes. BODIPY-positive area per cell values were normalized to the mean values of Ttyh1 WT control. Violin plots show median (solid line), interquartile range (dotted line), and probability density of data (smoothed shape). Number of astrocytes (n) from ≥3 independent experiments is shown underneath each violin plot. Mann–Whitney test. Source data are provided as a Source Data file.
Fig. 6
Fig. 6. Lipids secreted by IL-1β-stimulated neurons inhibit autophagic flux in astrocytes.
a IL-1β induces C1P production and secretion in mouse cortical neurons. Data were presented as mean ± SEM. Number of independent lipid samples (n) is shown in bracket at the bottom of each bar. One-way ANOVA (Intracellular: F = 33.81, df = 8; Extracellular: F = 3214, df = 11) followed by Tukey’s multiple comparisons post hoc test. b Schematic representation of extracting lipids from neuronal conditioned medium (NCM). NCM lipids derived from IL-1β-treated and untreated neurons are referred to as IL-1β-lipids and naïve-lipids, respectively. c, d Autophagic flux inhibition by IL-1β-lipids is exacerbated by Ttyh1 deficiency and is neuronal Cerk-dependent. cKO astrocytes were treated with NCM lipids for 30 min. For the C1P (+) groups, 0.5 µM C1P was added with NCM lipids. Shown are representative immunoblot images (c) and quantifications of p62 and LC3 levels (d) from n = 3 independent experiments. Same samples were also loaded on a separate gel for probing Ttyh1 expression. Ratios were normalized to that of Ttyh1 WT-naïve-lipids control on the same blot. Data were presented as mean ± SEM. One-way ANOVA (p62/αTub: F = 40.74, df = 23; LC3-II/LC3-I: F = 118.1, df = 23) followed by Bonferroni’s multiple comparisons post hoc test. e, f TTYH1 overexpression in human astrocytes rescues IL-1β-lipids-induced autophagic flux inhibition. NCM lipids were derived from human iNeurons. Shown are representative immunoblot images (e) and quantifications of p62 and LC3 levels (f). Ratios were normalized to that of mock-naïve-lipids control on the same blot. Data were presented as mean ± SEM. Number of biological replicates (n) is shown at the bottom of each bar. One-way ANOVA (p62/αTUB: F = 13.5, df = 26; LC3-II/LC3-I: F = 35.09, df = 50) followed by Bonferroni’s multiple comparisons post hoc test. n.s. not significant, P > 0.999. Source data are provided as a Source Data file.
Fig. 7
Fig. 7. Lipids secreted by IL-1β-stimulated neurons cause lipid droplet accumulation in Ttyh1-deficient astrocytes.
a Neuronal C1P production regulates TAG abundance in Drosophila heads. Each datapoint represents one cohort of ≥20 fly heads. Absorbance values from the colorimetric TAG assay were normalized to the mean of controls (Switch OFF). Number of independent lipid extracts (n) from fly heads is shown in brackets at the bottom of each bar. Unpaired two-tailed t-test (Cerk: t = 6.881, df = 12; Cerk-IR: t = 28.87, df = 4). b, c Loss of TTYH1 exacerbates IL-1β-lipids-induced lipid droplet (LD) accumulation in astrocytes. Shown are representative confocal images (b) and quantifications of BODIPY signals (c). Values were normalized to the mean of the ctrl-shR-naïve-lipids controls. One-way ANOVA (F = 11.79, df = 190) followed by Bonferroni’s multiple comparisons post hoc test. d Astrocytic Ttyh1 and neuronal C1P production are associated with the IL-1β-lipids-induced LD accumulation in astrocytes. Quantifications of BODIPY signals are shown. Values were normalized to the mean of Ttyh1 WT-naïve-lipids controls. One-way ANOVA (F = 11.79, df = 190) followed by Bonferroni’s multiple comparisons post hoc test. e Schematic representation of the neuron-astrocyte coculture system. f Ttyh1 KO astrocytes cocultured with IL-1β-stimulated neurons accumulate LDs. Shown are quantifications of BODIPY signals in astrocytes after coculture. Values were normalized to the mean of Ttyh1 WT-beads controls. One-way ANOVA (F = 4.395, df = 108) followed by Bonferroni’s multiple comparisons post hoc test. n.s. not significant, P > 0.9999. g Loss of Ttyh1 exacerbated TAG accumulation in astrocytes cocultured with IL-1β-stimulated neurons. TAG contents in astrocytes were measured after coculture. In C1P (+) groups, 0.5 µM C1P was added to the coculture medium. Absorbance values from the colorimetric TAG assay were normalized to the mean of Ttyh1 WT-naïve-ctrl-shR controls. Number of independent lipid extracts (n) from ≥3 independent experiments is shown in brackets at the bottom of each bar. One-way ANOVA (F = 937.6, df = 77) followed by Bonferroni’s multiple comparisons post hoc test. ***P < 0.001. Violin plots in (cf) represent median (solid line), interquartile range (dotted line), and probability density of data (smoothed shape). Number of astrocytes (n) from ≥3 independent experiments is shown in brackets underneath each violin plot. Bar charts in (a, g) represent mean ±  SEM. Source data are provided as a Source Data file.
Fig. 8
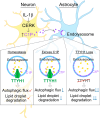
Fig. 8. Graphical abstract of the current study.
Inflammatory cytokine stimulates C1P biosynthesis in neurons. C1P and other lipid metabolites secreted by neurons are taken up by the astrocyte endolysosomes, where they are processed by resident enzymes. TTYH1 facilitates the extraction of C1P from endolysosomal membrane, which is necessary for maintaining autophagic flux and lipid droplet degradation. Excessive C1P internalized by astrocytes slows down autophagic flux and reduces lipid droplet degradation. These catabolic activities are further impaired upon TTYH1 deficiency, resulting in autophagic flux blockage and lipid droplet accumulation.

References

    1. Bonvento, G. & Bolanos, J. P. Astrocyte-neuron metabolic cooperation shapes brain activity. Cell Metab.33, 1546–1564 (2021). - PubMed
    1. Quick, J. D. et al. Lysosomal acidification dysfunction in microglia: an emerging pathogenic mechanism of neuroinflammation and neurodegeneration. J. Neuroinflammation20, 185 (2023). - PMC - PubMed
    1. Mishra, S. K. & Tiwari, S. P. Bioenergetics of axon integrity and its regulation by oligodendrocytes and schwann cells. Mol. Neurobiol.61, 5928–5934 (2024). - PubMed
    1. Mahmoud, A. I. Metabolic switches during development and regeneration. Development150, dev202008 (2023). - PMC - PubMed
    1. Pellerin, L. et al. Activity-dependent regulation of energy metabolism by astrocytes: an update. Glia55, 1251–1262 (2007). - PubMed

LinkOut - more resources