. 2025 May 31;15(1):19126.
doi: 10.1038/s41598-025-03920-w.

A machine learning-derived angiogenesis signature for clinical prognosis and immunotherapy guidance in colon adenocarcinoma

Affiliations

A machine learning-derived angiogenesis signature for clinical prognosis and immunotherapy guidance in colon adenocarcinoma

Hengrui Du et al. Sci Rep. .

Abstract

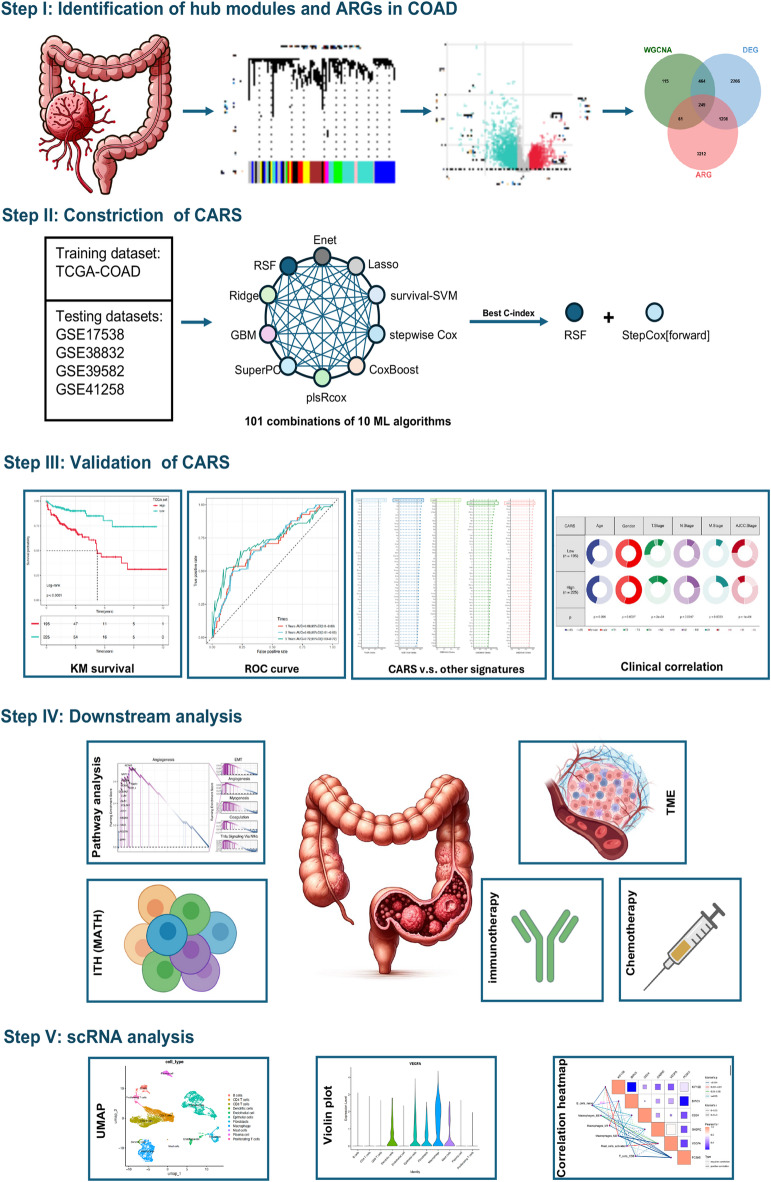
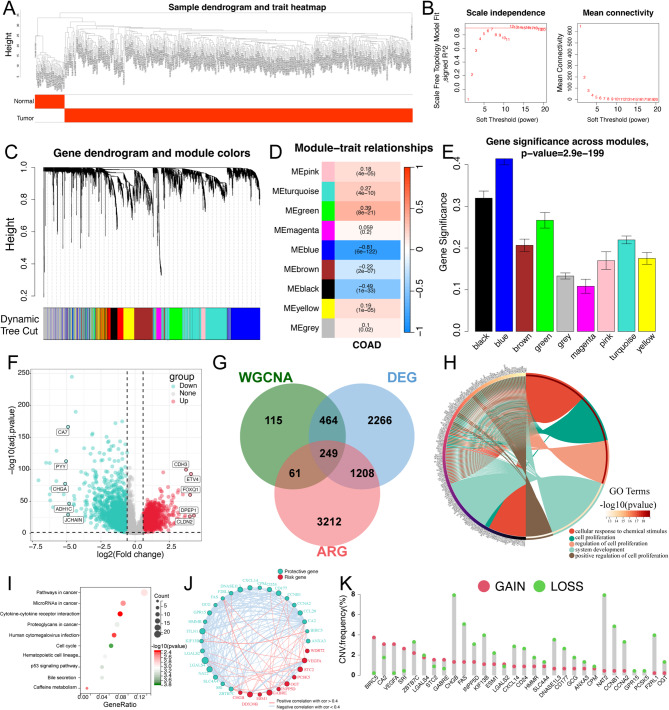
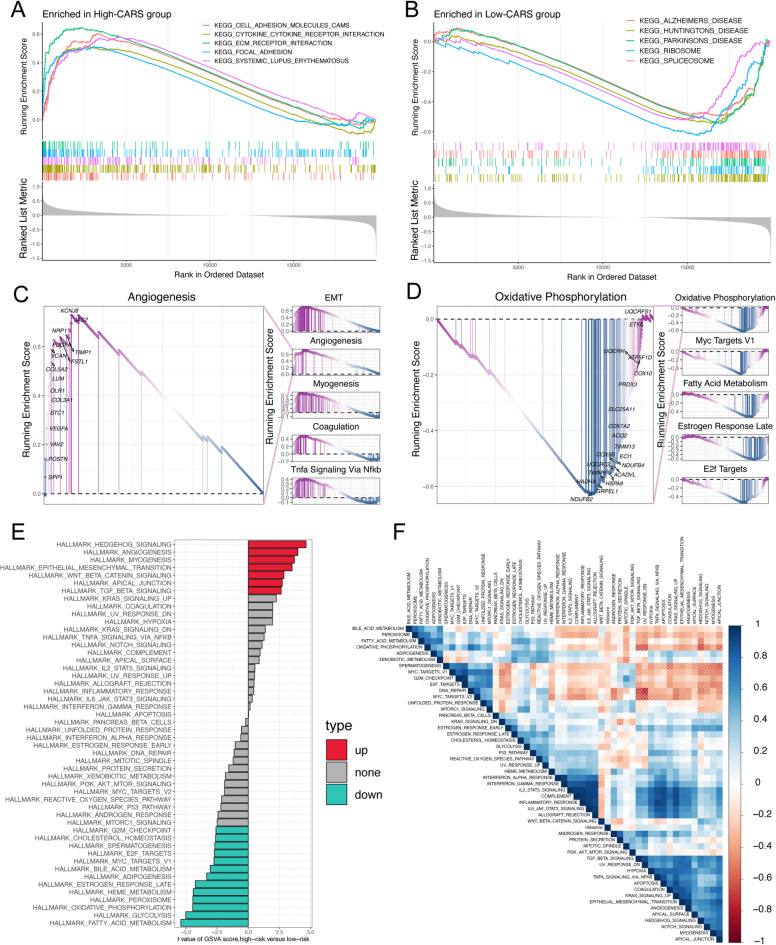
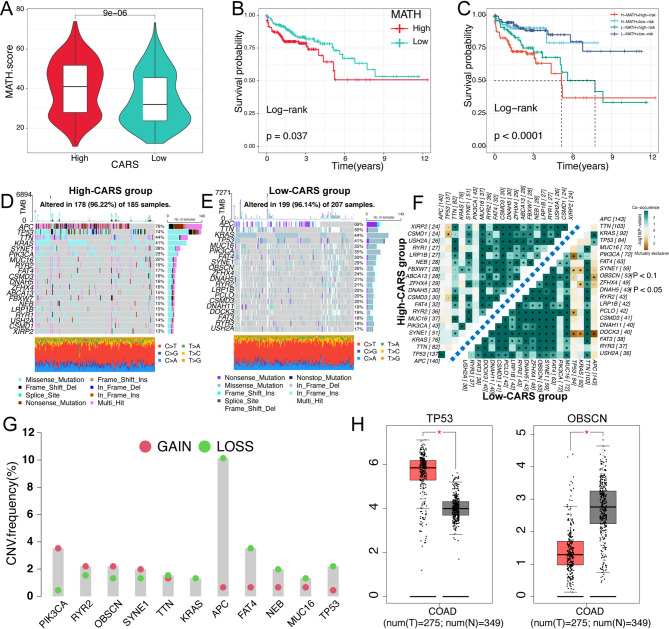
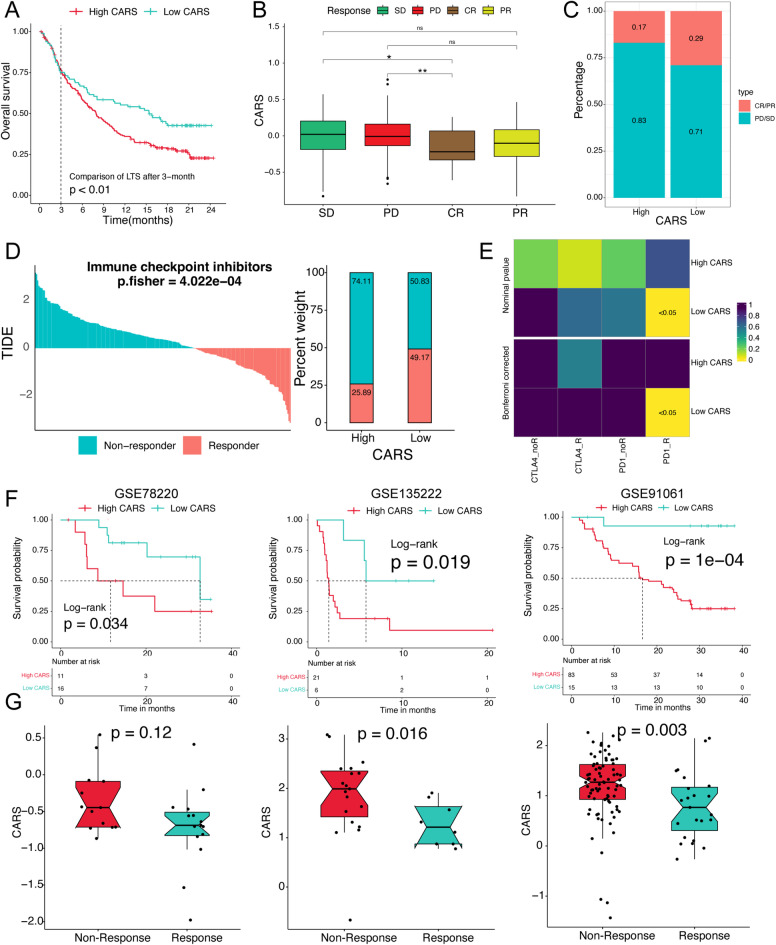
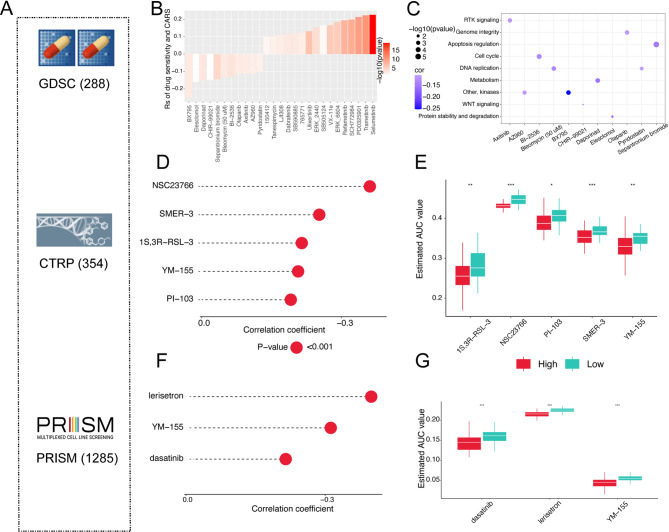
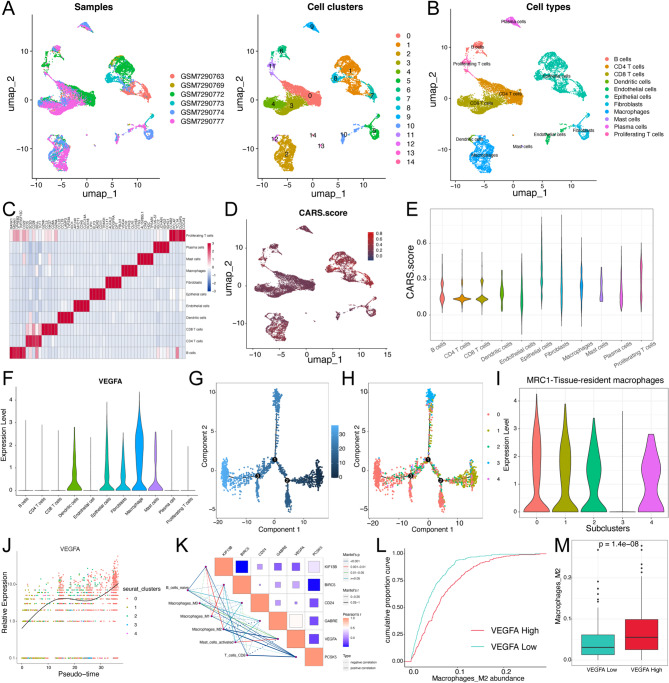
Colon adenocarcinoma (COAD) is one of the most prevalent malignancies worldwide and its prognosis is extremely poor. Angiogenesis has been linked to clinical outcomes, tumor progression, and treatment sensitivity. However, the role of angiogenesis in the COAD microenvironment and its interaction with immunotherapy remains unclear. In this study, an integrative machine learning approach, including ten algorithms, was used to construct a prognostic consensus angiogenesis-related signature (CARS) for COAD. The optimal CARS constructed using the RSF + StepCox [forward] algorithm had superior performance for clinical prognostic prediction and served as an independent risk predictor for COAD. Patients in the low-CARS group, characterized by immune activation, elevated tumor mutation/neoantigen burden, and greater responsiveness to immunotherapy, had a superior prognosis. Patients in the high-CARS group exhibited a poor prognosis with higher angiogenesis activity and immunosuppressive status, indicating lower immunotherapy benefits. However, axitinib and olaparib may be promising treatment options for such patients. Taken together, we constructed a prognostic CARS that provides prognostic stratification and elucidates the characteristics of the tumor microenvironment, which might guide the selection of personalized treatments for patients with COAD.

Keywords: Angiogenesis; Colon adenocarcinoma; Immunotherapy; Machine learning; Single cell RNA-seq; Tumor microenvironment.


Conflict of interest statement

Declarations. Competing interests: The authors declare no competing interests.

Figures

Fig. 1
Fig. 1
The overall flow chart of this article.
Fig. 2
Fig. 2
Identification of important co-expression modules and prognostic angiogenesis-related genes (ARGs). (A) A dendrogram displaying the clustering of samples with a heatmap showing the traits in the TCGA dataset. (B) Determination of soft thresholding power. (C) Dendrogram displaying the clustering of gene modules and the merging of modules. (D) Correlation between different modules and COAD. (E) Gene significance across the different modules. (F) Heatmap of differentially expressed genes (DEGs) between normal and COAD samples from TCGA dataset. (G) Venn diagram of module genes, DEGs, and ARGs. (H) GO annotation of the candidate genes. (I) KEGG enrichment pathways for the candidate genes. (J) Univariate Cox regression analysis of candidate genes and correlations between prognostic ARGs. (K) Frequency of copy number variation (CNV) in prognostic ARGs.
Fig. 3
Fig. 3
Construction and validation of a stable CARS using a machine-learning-based integrative algorithm. (A) A combination of 101 machine learning algorithms was generated using a ten-fold cross-validation computational framework. The C-index of each model was calculated in TCGA, GSE17538, GSE38832, GSE39582, and GSE41258 datasets and sorted based on the mean C-index. (B) Regression coefficients of the six genes obtained using the RSF + StepCox [forward] algorithm. (C) Survival analysis of patients with COAD between the low- and high-CARS groups across all the datasets. (D) ROC curves showing the specificity and sensitivity of CARS across all datasets.
Fig. 4
Fig. 4
Correlation of clinical variables with CARS and development of a clinical nomogram. (A) Distribution of clinical variables and expression of the six most valuable genes based on CARS. (B) Correlation between the low- and high-CARS groups and clinical variables. (C) Comparison of CARS scores among the different groups stratified by clinical variables. (D) Univariate Cox regression analysis of clinical variables and CARS scores. (E) Multivariate Cox regression analysis of clinical variables and CARS scores. (F) A comprehensive nomogram for predicting the survival probability of patients with COAD. (G) Comparison of the C-index between the nomogram and the other clinical variables. (H) Decision curve analysis of nomogram and other clinical variables. (I) Calibration curves of the nomogram at 1-, 3-, and 5-year intervals. * P < 0.05, ** P < 0.01, **** P < 0.0001.
Fig. 5
Fig. 5
Molecular landscape of patients with COAD in the different CARS groups. (A) KEGG enrichment pathway enriched in the high-risk group using GSEA. (B) KEGG enrichment pathway enriched in the low-risk group using GSEA. (C) Hallmark pathway enrichment in the high-risk group using GSEA. (D) Hallmark pathway enrichment in the low-risk group using GSEA. (E) Differences in hallmark pathway activities between the low- and high-CARS groups, as scored by GSVA. (F) Correlation analysis of CARS with hallmark pathway activities, as scored by GSVA.
Fig. 6
Fig. 6
Intratumoral heterogeneity alterations between the low- and high-CARS groups. (A) The difference in mutant allele tumor heterogeneity (MATH) scores between the low- and high-CARS groups. (B) Kaplan-Meier curve of overall survival between the low- and high-MATH groups. (C) Kaplan-Meier curve of overall survival by combining CARS and MATH. (D) Waterfall plot of the somatic mutation landscape in the high-CARS group. (E) Waterfall plot of the somatic mutation landscape in the low-CARS group. (F) Correlations of co-occurrence and exclusive mutations among the top 20 mutated genes in the high- and low-risk groups. (G) Copy number variation (CNV) frequency of genes shared between the low- and high-CARS groups. (H) Expression patterns of TP53 and OBSCN in normal and COAD samples. * P < 0.05.
Fig. 7
Fig. 7
Tumor microenvironment (TME)-related molecular characteristics of the low- and high-CARS groups. (A) Distribution of TME immune cell-type signatures between the different CARS groups. (B) Distribution of immune suppression signatures among the different CARS groups. (C) Distribution of immune exclusion signatures between different CARS groups. (D) Distribution of immunotherapy biomarkers between different CARS groups. (E) Representative clinicopathology images of different CARS groups were acquired from the TCGA data. Red arrows highlight immune cell infiltration regions. (F) Distribution of tumor mutation burden (TMB) between the different CARS groups. (G) Distribution of tumor neoantigen burden (TNB) between the different CARS groups. (H) Kaplan-Meier curve of overall survival by combining CARS with TMB. (I) Kaplan-Meier curve of overall survival by combining CARS with TNB. ns P > 0.05, * P < 0.05, ** P < 0.01, **** P < 0.0001.
Fig. 8
Fig. 8
The value of CARS in predicting immunotherapy response. (A) The long-term survival (LTS) difference after 3 months of treatment between low- and high-CARS groups in iMvigor210 dataset. (B) The distribution of CARS in different immunotherapy response groups. (C) The proportion of clinical response to immunotherapy between low- and high-CARS groups. (D) The TIDE algorithm predicting the immunotherapy response between low- and high-CARS groups. (E) The subclass mapping model predicting the immunotherapy response between low- and high-CARS groups. (F) Kaplan-Meier curve between low- and high-CARS groups in the GSE78220, GSE135222, and GSE91061 datasets. (G) Comparison of overall response rates between low- and high-CARS groups in the GSE78220, GSE135222, and GSE91061 datasets. ns P > 0.05, * P < 0.05, ** P < 0.01.
Fig. 9
Fig. 9
Identification of potentially applicable drugs for the high-CARS group. (A) A total of 1,927 compounds were used to identify potential therapeutic targets and compounds for the high-CARS group. (B) The correlation analysis of CARS with estimated IC50 values from GDSC. (C) The signaling pathways and therapeutic targets of the 11 candidate compounds from GDSC. (D) The correlation analysis of CARS with estimated AUC values from CTRP. (E) Differential analysis of drug response from CTRP between low- and high-CARS groups. (F) The correlation analysis of CARS with estimated AUC values from PRISM. (G) Differential analysis of drug response from PRISM between low- and high-CARS groups. * P < 0.05, ** P < 0.01, *** P < 0.001, **** P < 0.0001.
Fig. 10
Fig. 10
Single cell analysis revealing VEGFA correlates with the differentiation fate of macrophages. (A) Uniform manifold approximation and projection (UMAP) of 6 COAD samples and 15 cell clusters. (B) 11 cell types were identified by marker genes. (C) Heatmap showing the top 5 marker genes in each cell cluster. (D) The activity score of CARS in each cell cluster. (E) The distribution of the CARS across different cell types. (F) The expression of VEGFA across different cell types. (G) Pseudotime trajectory analysis of all macrophages and the root cells of the trajectory were marked by the dark blue. (H) Macrophages were clustered into five subclusters after UMAP dimensionality reduction. (I) The expression of MRC-1 across different subclusters of macrophages. (J) The dynamic expression profile of VEGFA in macrophages pseudotime trajectory. (K) A correlation heatmap indicating the relationships among VEGFA and different immune cell infiltration. (L) The cumulative proportion curves of M2 abundance between low- and high-VEGFA expression. (M) violin plot of M2 abundance between low- and high-VEGFA expression.

Similar articles

References

    1. Sung, H. et al. Global Cancer statistics 2020: GLOBOCAN estimates of incidence and mortality worldwide for 36 cancers in 185 countries. CA Cancer J. Clin.71, 209–249. 10.3322/caac.21660 (2021). - PubMed
    1. Siegel, R. L., Giaquinto, A. N. & Jemal, A. Cancer statistics, 2024. CA Cancer J. Clin.74, 12–49. 10.3322/caac.21820 (2024). - PubMed
    1. Siegel, R. L. et al. Colorectal cancer statistics, 2020. CA Cancer J. Clin.70, 145–164. 10.3322/caac.21601 (2020). - PubMed
    1. Bu, P. et al. miR-1269 promotes metastasis and forms a positive feedback loop with TGF-β. Nat. Commun.6, 6879. 10.1038/ncomms7879 (2015). - PMC - PubMed
    1. Dekker, E., Tanis, P. J., Vleugels, J. L. A., Kasi, P. M. & Wallace, M. B. Colorectal cancer. Lancet394, 1467–1480. 10.1016/s0140-6736(19)32319-0 (2019). - PubMed

Substances

LinkOut - more resources