. 2025 May 31;15(1):19181.
doi: 10.1038/s41598-025-04044-x.

Saliva-based lacosamide monitoring paves the way toward personalized epilepsy pharmacotherapy

Affiliations

Saliva-based lacosamide monitoring paves the way toward personalized epilepsy pharmacotherapy

Yoonhyuk Jang et al. Sci Rep. .

Abstract

Saliva, known for better patient compliance and simpler collection, is ideal for monitoring antiseizure medication (ASM) levels. This study aimed to validate saliva for measuring lacosamide, develop a pharmacokinetic (PK) model, and determine the optimal saliva concentration for seizure control in epilepsy patients. In our prospective study at Seoul National University Hospital from August 2021 to November 2022, we enrolled lacosamide-prescribed epilepsy patients, collecting their saliva and blood samples. We developed a population PK model with nonlinear mixed-effects modeling, incorporating a saliva compartment and plasma-to-saliva distribution scaling factor. The model, factoring in CYP2C19 genotypes, demographics, and concurrent ASM use, estimated optimal saliva lacosamide concentration cutoffs for well-controlled seizures in high seizure burden patients. These values were validated through a two-year longitudinal analysis. In our study, 123 epilepsy patients prescribed lacosamide were finally analyzed. We identified 74 matched pairs of blood and saliva samples, finding a linear relationship between their lacosamide concentrations (R = 0.62, P < 0.001). Using our PK model, we estimated individual peak (Cmax) and trough concentrations in saliva and blood based on dosage, determining optimal saliva cutoffs for well-controlled seizure status in lacosamide: 15.94 mg/L for Cmax and 9.056 mg/L for trough, with 72.7% sensitivity and 88.2% specificity. Longitudinal analysis showed well-controlled seizure status achievement aligning with times when estimated Cmax and trough surpassed these cutoffs. Our research presents the potential and validity of using saliva concentration as an alternative to blood concentration for lacosamide TDM, advancing personalized pharmacotherapy in epilepsy treatment.

Keywords: Lacosamide; Lacosamide pharmacokinetics; Personalized medicine; Saliva-based TDM.


Conflict of interest statement

Declarations. Competing interests: The authors declare no competing interests. Ethics approval and consent to participate: This study was approved by the Seoul National University Hospital Institutional Review Board (IRB No. 2104-146-1213) and written informed consent was obtained from all patients and/or legal guardians. All co-authors have reviewed and approved the contents of the manuscript, and the Scientific Reports requirements for authorship have been met. We confirm that we have read the journal’s position on issues related to ethical publication and affirm that this report is consistent with those guidelines. We certify that the submission (aside from an abstract) is not under review by any other publication. No previous report overlaps with the current work. We have no conflicts of interest to declare.

Figures

Fig. 1
Fig. 1
Analysis of lacosamide Levels in blood and saliva in relation to dosage and genotype. (A, B) The linear correlation was shown between BSA-normalized daily dose of lacosamide (mg/m2/day) and its concentration in (A) blood (n = 86) and (B) saliva (n = 109), respectively. (C) A linear regression model described the relationship between blood and saliva lacosamide levels (n = 74) (Csaliva = 4.932 + 0.652 × Cblood, adjusted R2 = 0.38). (D, E) Boxplots represent the dose-normalized (D) blood (n = 146) and (E) saliva (n = 37) levels of lacosamide across three CYP2C19 genotype group, respectively, with significance determined using the Jonckheere-Terpstra test (blood level: P < 0.001, saliva level: P = 0.029). Dose normalization was calculated as concentration × 300 mg/day/daily dose (mg/day). Data in blood sample were merged with the previous study (Supplementary Table 1). BSA body surface area.
Fig. 2
Fig. 2
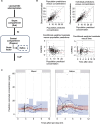
Development of the population PK model for lacosamide. (A) Structure of lacosamide PK model, including a scale factor for plasma-to-saliva distribution of lacosamide. Ka, first order rate constant; CL/F, apparent clearance. (B) Goodness-of-fit-plots for the PK model of lacosamide, comparing observations with population and individual predictions, and displaying CWRES versus population predictions and time after last dose. (C) A prediction corrected visual predictive check of lacosamide model, stratified by blood and saliva groups. This part includes 500 simulated datasets. The observed concentrations are indicated by closed circles, with solid lines representing the 5th (blue), median (red), and 95th (blue) percentiles of the observed concentrations. The shaded blue and red areas highlight the 95% confidence intervals of the simulated concentrations for each percentile. CWRES conditional weighted residuals; PK pharmacokinetics.
Fig. 3
Fig. 3
Determination and validation of optimal cutoff values for saliva lacosamide concentration in the high seizure burden group. (A) In this group (n = 28), the optimal cutoff for peak saliva lacosamide concentration (Cmax) for achieving well-controlled seizure status was 15.94 mg/L, with a sensitivity of 72% and specificity of 88.2%. (B) The longitudinal analysis revealed a temporal correlation between achieving well-controlled seizure status and instances where Cmax exceeded 15.9 mg/L. The solid lines represent corresponding LOESS regression lines, with shaded areas indicating 95% CIs. The various colored spaghetti plots represent the longitudinal data for individual patients, tracking the changes in their lacosamide levels over time. (C) Comparison of estimated peak saliva concentrations before and after achieving seizure control showed significant differences (pre-4 months: 13.72 mg/L, at achievement: 16.51 mg/L, post-4 months: 15.87 mg/L, multiple comparison correction by Tukey’s method). (D) The optimal trough level cutoff was 9.056 mg/L, with the same sensitivity and specificity. (E) Well-controlled seizure status achievement times corresponded with trough levels above 9.06 mg/L. The solid lines represent corresponding LOESS regression lines, with shaded areas indicating 95% CIs. The various colored spaghetti plots represent the longitudinal data for individual patients, tracking the changes in their lacosamide levels over time. (F) Notable differences were observed in trough concentrations before and after seizure control (pre-4 months: 8.65 mg/L, at achievement: 10.32 mg/L, post-4 months: 9.92 mg/L, multiple comparison correction by Tukey’s method). CI confidence interval; LOESS locally estimated scatterplot smoothing.
Fig. 4
Fig. 4
Subgroup analysis in the high seizure burden group assessing the impact of lacosamide dosage increments on seizure control. (A) Saliva concentrations of lacosamide (spot, Cmax, and trough) in the high seizure burden group exhibited significant trends in the Jonckheere-Terpstra test, with the highest levels in patients having more than one seizure event per day and the lowest in those with one event every two weeks (spot level: P = 0.033; Cmax: P = 0.041; Trough: P = 0.033). (B) A longitudinal analysis comparing the severe (n = 9) and less-severe (n = 19) seizure burden groups showed a significantly faster decline in seizure frequency in the severe group (β =  − 0.234, 95% CI, − 0.376 to − 0.090, P = 0.002). (C) In the same comparison, the lacosamide dose increased more rapidly in the severe group (β = 2.043, 95% CI, 0.315 to 3.816, P = 0.023). (D) There was no significant time-dependent difference in the number of ASM prescribed between the two groups (β =  − 0.009, 95% CI, − 0.020 to 0.002, P = 0.126). The solid lines of (B), (C), and (D) represent corresponding LOESS regression lines, with shaded areas indicating 95% CIs. (E) The heatmaps illustrate the time-dependent changes in lacosamide dose and ASM number, highlighting a more intense augmentation of lacosamide dose in the severe seizure burden group compared to the less-severe group, without significant differences in ASM number. ASM antiseizure medication; CI confidence interval; LOESS locally estimated scatterplot smoothing.

References

    1. Kanner, A. M. et al. Practice guideline update summary: Efficacy and tolerability of the new antiepileptic drugs II: Treatment-resistant epilepsy. Neurology91, 82–90. 10.1212/WNL.0000000000005756 (2018). - PubMed
    1. Ben-Menachem, E. et al. Efficacy and safety of oral lacosamide as adjunctive therapy in adults with partial-onset seizures. Epilepsia48, 1308–1317. 10.1111/j.1528-1167.2007.01188.x (2007). - PubMed
    1. Chung, S. et al. Lacosamide as adjunctive therapy for partial-onset seizures: A randomized controlled trial. Epilepsia51, 958–967. 10.1111/j.1528-1167.2009.02496.x (2010). - PubMed
    1. Zaccara, G., Perucca, P., Loiacono, G., Giovannelli, F. & Verrotti, A. The adverse event profile of lacosamide: A systematic review and meta-analysis of randomized controlled trials. Epilepsia54, 66–74. 10.1111/j.1528-1167.2012.03589.x (2013). - PubMed
    1. Babar, R. K., Bresnahan, R., Gillespie, C. S. & Michael, B. D. Lacosamide add-on therapy for focal epilepsy. Cochrane Database Syst. Rev.10.1002/14651858.CD008841.pub3 (2021). - PMC - PubMed