. 2025 May 31;24(1):235.
doi: 10.1186/s12933-025-02780-y.

Tenascin-C drives cardiovascular dysfunction in a mouse model of diabetic cardiomyopathy

Affiliations

Tenascin-C drives cardiovascular dysfunction in a mouse model of diabetic cardiomyopathy

Zsuzsanna Arnold et al. Cardiovasc Diabetol. .

Abstract

Background: Diabetic cardiomyopathy (DCM) is a complex condition linked to diabetes, characterized by cardiac and vascular dysfunction, frequently concomitant with heart failure with preserved ejection fraction. The extracellular matrix glycoprotein Tenascin-C (TNC) has been found to be upregulated under diabetic conditions. However, the potential contributory role of TNC in the progression of DCM remains largely unclear. This study was designed to elucidate the role of TNC in the pathogenesis of DCM.

Methods: Diabetes was induced in adult male wild-type (WT) and TNC knockout (TNC-KO) mice, through the administration of streptozotocin (50 mg/kg) for five consecutive days. At 18 weeks cardiac and aortic vascular function was evaluated using echocardiography and wire myography. Myocardium and plasma samples were collected for biochemical, histological, and molecular analyses. Cardiomyocytes and cardiac fibroblasts were used to investigate the impact of diabetes on TNC expression, inflammation, myocardial stiffness and function. Additionally, transcriptomic analysis of cardiac tissue by RNA-sequencing was conducted. Plasma TNC levels were assessed by enzyme-linked immunosorbent assay in cohorts of heart failure patients and type 2 diabetes mellitus.

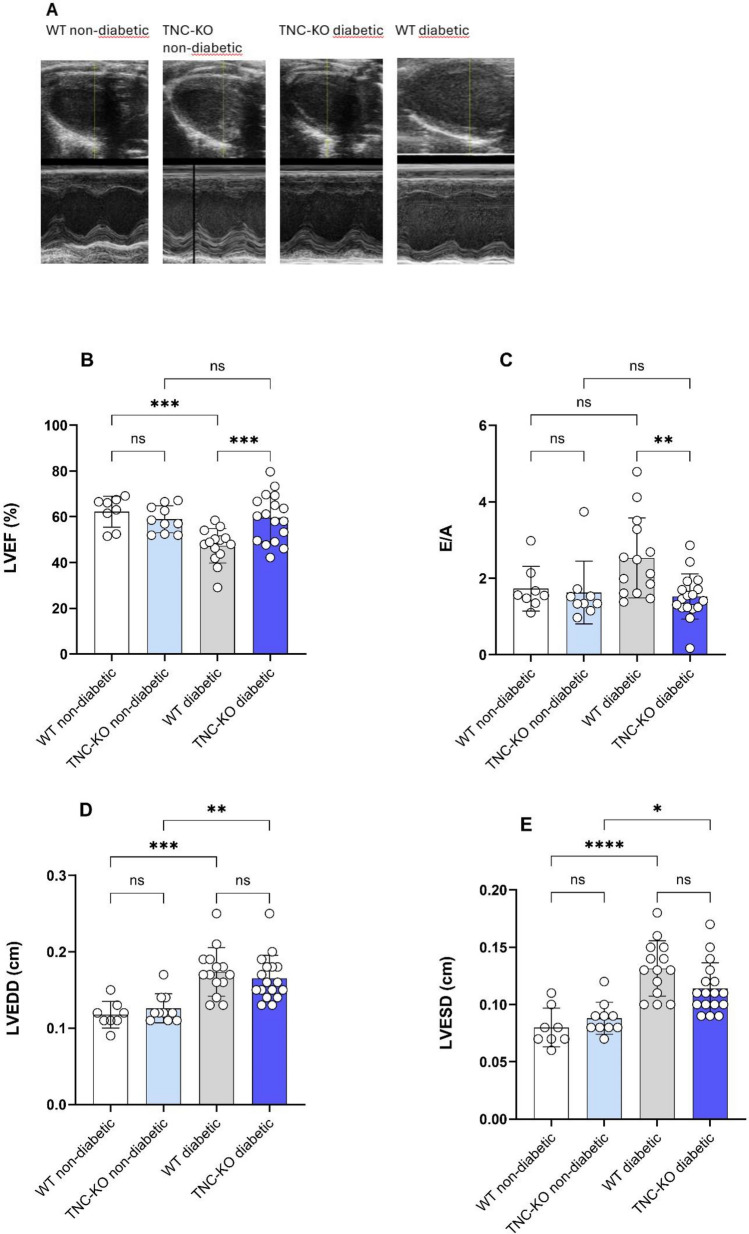
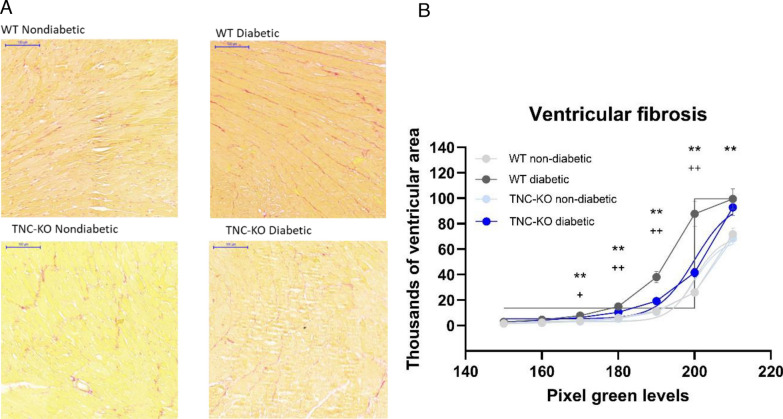
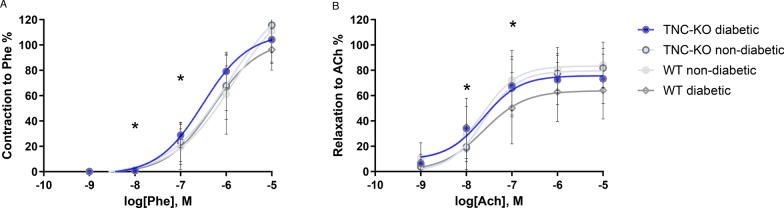
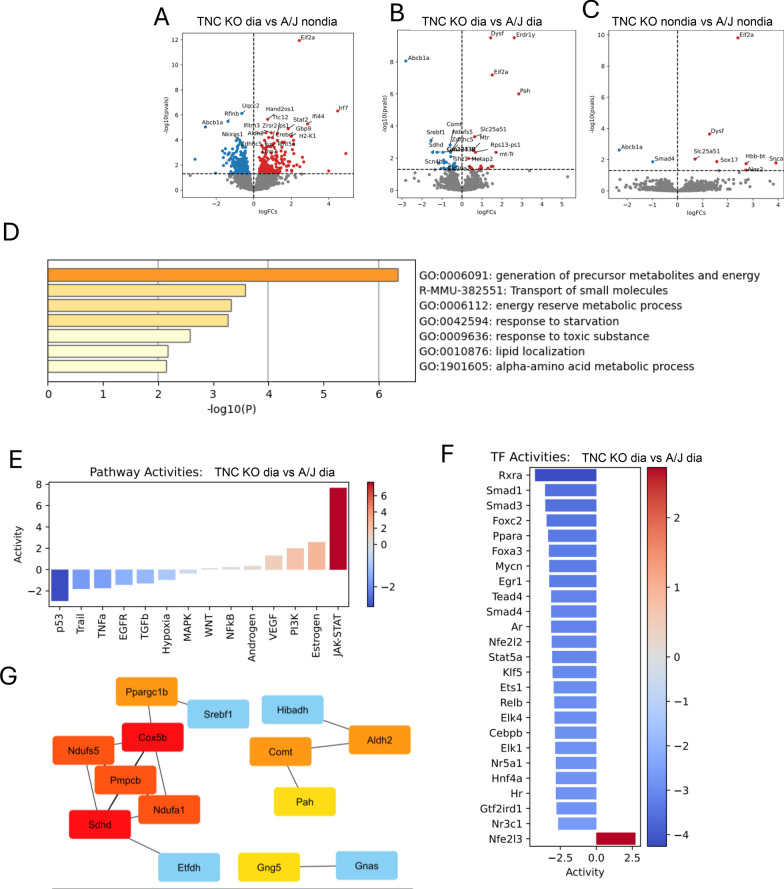
Results: TNC-KO diabetic mice showed preserved left ventricular systolic and diastolic function, significantly reduced cardiac fibrosis and mitigated endothelial dysfunction compared to WT diabetic animals. Compared with cardiomyocytes of diabetic WT animals, cardiomyocytes of TNC-KO mice developed less stiffness (Fpassive). Additionally, exposing mouse cardiomyocytes and human cardiac fibroblasts to high glucose stress (30 mM) led to a significant increase in TNC expression. Conversely, recombinant human TNC promoted pro-inflammatory and oxidative stress markers in cardiomyocytes. The role of TNC in fibrosis and DCM was found to involve pathways related to p53 signaling and Serpin1k, Ccn1, Cpt1a, and Slc27a1, as identified by RNA sequencing analysis. Additionally, plasma TNC levels were significantly elevated in patients with heart failure, irrespective of diabetes status, compared to healthy individuals.

Conclusions: Our findings indicate that in diabetes, TNC contributes to cardiac contractile dysfunction, myocardial fibrosis, oxidative stress, inflammation, and metabolic disturbances in diabetic mouse heart. These results implicate the potential of TNC inhibition as a novel therapeutic approach for treating DCM.

Keywords: Diabetic cardiomyopathy; Fibrosis; Heart failure pathophysiology; Inflammation; Tenascin-C.


Conflict of interest statement

Declarations. Ethics approval and consent to participate: The experimental protocol was approved by the regional Ethics Committee for Laboratory Animal Experiments at the Medical University of Vienna and the Austrian Ministry of Science Research and Economy (BMWFW- 66.009/0014-V/3b/2018). All procedures conform to the guidelines from ARRIVE and Directive 2010/63/EU of the European Parliament on the protection of animals used for scientific purposes. The MetAnEnd study was conducted according to the International Conference on Harmonization and Good Clinical Practice guidelines and the Declaration of Helsinki. It was approved by the ethical review board at Karolinksa Institutet (Stockholm, Sweden). Written informed consent was obtained from all participants prior to study participation. Consent for publication: All authors have read and agreed to the publication of this manuscript. Competing interests: The authors declare no competing interests.

Figures

Fig. 1
Fig. 1
Echocardiographic parameters 18 weeks after diabetes induction. A Representative images of transthoracic echocardiography with LVEF measurement in the longitudinal axis. B and C Preserved systolic and diastolic function in TNC-KO diabetic animals compared to wild-type mice with diabetes (LVEF and E/A ratio; mean ± SD, n = 8–17/group). D and E Left ventricular diameters: LVEDD and LVESD; mean ± SD, n = 8–17/group. F and G Invasive hemodynamic measurements. LVSP and LVEDP changes (mean ± SD, n = 5–7/group). H and I Contractility in TNC deficient diabetic mice compared to WT animals as illustrated by LVSP, dP/dtmax and dP/dtmin (F, H, I; mean ± SD, n = 5–7/group). DM, diabetes mellitus; dP/dt, derivative of pressure over time; LV, left ventricle; LVEDD, left ventricular end-diastolic diameter; LVEDP, left ventricular enddiastolic pressure; LVEF, left ventricular ejection fraction; LVESD, left ventricular endsystolic diameter; LVSP, left ventricular systolic pressure; STZ, streptozotocin; TNC-KO, Tenascin-C knock-out; WT, wild-type; ****p < 0.0001; ***p < 0.001; **p < 0.01; *p < 0.05; ns not significant
Fig. 1
Fig. 1
Echocardiographic parameters 18 weeks after diabetes induction. A Representative images of transthoracic echocardiography with LVEF measurement in the longitudinal axis. B and C Preserved systolic and diastolic function in TNC-KO diabetic animals compared to wild-type mice with diabetes (LVEF and E/A ratio; mean ± SD, n = 8–17/group). D and E Left ventricular diameters: LVEDD and LVESD; mean ± SD, n = 8–17/group. F and G Invasive hemodynamic measurements. LVSP and LVEDP changes (mean ± SD, n = 5–7/group). H and I Contractility in TNC deficient diabetic mice compared to WT animals as illustrated by LVSP, dP/dtmax and dP/dtmin (F, H, I; mean ± SD, n = 5–7/group). DM, diabetes mellitus; dP/dt, derivative of pressure over time; LV, left ventricle; LVEDD, left ventricular end-diastolic diameter; LVEDP, left ventricular enddiastolic pressure; LVEF, left ventricular ejection fraction; LVESD, left ventricular endsystolic diameter; LVSP, left ventricular systolic pressure; STZ, streptozotocin; TNC-KO, Tenascin-C knock-out; WT, wild-type; ****p < 0.0001; ***p < 0.001; **p < 0.01; *p < 0.05; ns not significant
Fig. 2
Fig. 2
Cardiomyocyte passive force. Elevated Fpassive was characteristic to all diabetic animals (AC). Cardiomyocytes of diabetic TNC-KO mice showed less increase in Fpassive compared to wild-type animals (A). There was no significant change in Factive between the groups (D). TNC-KO Tenascin-C knock-out (Data shown as mean ± SD; n = 7–12/group.)
Fig. 3
Fig. 3
Fibrosis in wild-type and Tenascin-C deficient non-diabetic and diabetic animals. Wild-type (WT) and Tenascin-C knockout (TNC-KO) mice, diabetic vs. non-diabetic. Picro-Sirius staining of ventricular tissue. Scanned, Bitmap pictures. Representative pictures of the left ventricular anterior wall. Picro-Sirius staining for collagen. Increased fibrosis is visible as purple staining in between cardiomyocyte fibers in WT diabetic mice (upper right). Less fibrosis was found in TNC-KO diabetic animals (bottom right) (A). Quantitative analysis of collagen content. Histogram for number of pixels with different green densities (ImageJ) **WT diabetic versus WT non-diabetic p < 0.01; +  + WT diabetic versus TNC-KO diabetic p < 0.01; + WT diabetic versus TNC-KO diabetic p < 0.05 (B). TNC-KO Tenascin-C knockout; WT wild-type (Data shown as mean ± SEM, n = 7/group, pixels with green densities ≤ 210 can be considered containing collagen)
Fig. 4
Fig. 4
Dose–response curves obtained from wire myograph measurements. Treatment of the vessels with phenylephrine induced similar contraction of the vessel walls in all animals (A). Acetylcholine (ACh) induced relaxation was impaired in the diabetic groups. TNC-KO animals showed restored relaxation compared to the WT mice (B). Endothelium-dependent relaxation to ACh significantly decreased in the diabetic WT group compared to non-diabetic WT animals (*p < 0.05). This attenuated relaxation was significantly restored in the aortas of diabetic TNC-KO mice. Statistics: two-way ANOVA. Data displayed as mean ± SD; n = 20–50 segments/group. Ach, acetylcholine; Phe, phenylephrine; TNC-KO, Tenascin-C knock-out; WT, wild-type
Fig. 5
Fig. 5
Apoptosis and CD68+ expression. A Representative images of terminal deoxynucleotidyl transferase-mediated dUTP nick-end labelling (TUNEL) staining for apoptotic cells in the left ventricular wall of wild-type (WT) and Tenascin-C knockout (TNC-KO) mice, diabetic vs. non-diabetic. TUNEL staining was performed to assess the extent and distribution of apoptotic cells in the cardiac tissue. Green dots represent apoptotic cells resulting from the mixture of TUNEL-stained and DAPI-counterstained nuclei. Blue dots represent non-apoptotic cells stained with DAPI only. No evidence of apoptosis was found in WT non-diabetic and TNC-KO non-diabetic heart tissue, whereas apoptotic cells were frequently found in areas thought to represent remodeling, visible as green staining in WT diabetic mice. Fewer TUNEL-positive cells were found in TNC-KO diabetic heart tissue compared to diabetic WT animals. Scale bar = 100 µm (200× magnification). B Immunoperoxidase staining for CD68. Representative images of myocardial tissue from WT and TNC-KO mice, diabetic vs. non-diabetic, showing CD68+ macrophages in the myocardium (magnification× 200, scale bar: 50 μm). (C) No statistical difference in numbers of CD68+ macrophages in the myocardium between the groups. The graph shows the number of CD68-positive cells. Data are expressed as mean ± SD; n = 4/group. (D)High glucose and (E)Tenascin C-induced apoptosis in H9C2 cells. Representative fluorescence pictures demonstrate the presence of positive TUNEL and DAPI as well as merged staining in positive control (cells were treated with 500 U/mL DNase I), negative control (cells were with the enzymatic solution without the labeled antibody), control, glucose (30 mM) and rh TNC (5 µg/mL) treatment groups. (G-H) Quantitative analysis of the TUNEL assay. DAPI, 4′,6-diamidino-2-phenylindole; Rh TNC, recombinant human Tenascin-C; TNC-KO, Tenascin-C knockout; TUNEL, terminal deoxynucleotidyl transferase-mediated dUTP nick-end labelling; WT, wildt-type. Data shown as mean ± SD, n = 3–6/ condition; *p < 0.05
Fig. 6
Fig. 6
Tenascin-C expression and pro-inflammatory cytokines. A and B Representative picture of Western Blot results. Tenascin-C expression in control (top row) and High Glucose treated (bottom row) NHFC cells. Representative photomicrographs of nuclei immunostaining using DAPI (left column), Tenascin-C (TNC) staining (middle column) and the combination of merged staining (right column). The white line represents the scale and corresponds to 20 µm in every image. Control NHFC cells (n = 3) and 48 h high-glucose treated (30 mM) NHFC cells (n = 3). C Western blot results show increased TNC protein expression under 30 mM glucose treatment in human NHFC cells. D Elevated glucose levels influence the DNA methylation of the TNC promoter compared to the control in H9c2 cells (ratio Me/UMe TNC promoter in hyperglycemic environment vs. control 49.35 versus 100, respectively; p = 0.0019). EG Oxidative stress markers after incubation with rh TNC. NOX4 and TNF-α levels increased significantly upon incubation with rhTNC (p = 0.0435 and p = 0.0180, respectively; E, G). IL-6 levels were also markedly elevated (D). C control; DAPI, 4’,6-diamidino-2-phenylindole; HG, high glucose; H9c2 cells, line of embryonic rat cardiomyocytes; IL-6, interleukin 6; Me/Ume, methylated/unmethylated TNC promoter; NHFC, normal human ventricular cardiac fibroblasts; NOX4, nicotinamide adenine dinucleotide phosphate oxidase 4; rh TNC, recombinant human Tenascin-C; TNF-α, tumor necrosis factor alpha; **p < 0.01; *p < 0.05. Data shown as mean ± SD, n = 3–6/group
Fig. 7
Fig. 7
Differential gene expression, pathway, and transcription factor activity analysis in A/J wild-type diabetic and non-diabetic mice. This figure illustrates the results of RNA sequencing and subsequent analyses comparing A/J diabetic mice to A/J non-diabetic mice. Panel A presents a volcano plot of differential gene expression, where the x-axis represents the log₂ fold change (log2FC), and the y-axis shows the negative logarithm (base 10) of the adjusted p-value (-log10(p-value)). Genes significantly upregulated (q-value < 0.05) are highlighted in red, and significantly downregulated genes are highlighted in blue, with the horizontal dashed line denoting the significance threshold. Panel B shows pathway activity analysis using the PROGENy framework, indicating significant downregulation of the PI3K and estrogen pathways, while upregulation is observed in the JAK-STAT pathway. Other pathways, such as TGF-β and p53, show minimal changes in activity. In panel C, pathway enrichment analysis using Metascape highlights the top enriched biological processes and pathways among the significantly differentially expressed genes, including “Cytoskeleton in muscle cells” (mmu04820), “Sarcomere organization” (GO:0045214), and “RHO GTPase cycle” (R-MMU-9012999), pointing to potential impacts on muscle cell structure and function. Panel D shows transcription factor activity analysis inferred using the decoupler package, where transcription factors such as Stat2, Irf9, Creb1, and Smad4 exhibit increased activity. At the same time Elk3 displays decreased activity, suggesting changes in transcriptional regulation, particularly related to inflammation and cellular stress responses. Panel E presents a hub gene analysis performed using Cytohubba, where highly connected hub genes are shown in red, intermediate hub genes in yellow, and neighboring nodes in blue. Genes such as Myh6, Myh7, Myom2, Lmod2, and Tnnt2 are central within this network, highlighting their involvement in muscle contraction and structure. This network illustrates key molecular interactions that may be influenced by diabetes in A/J mice
Fig. 8
Fig. 8
Differential gene expression, pathway, and transcription factor activity analysis in TNC-KO and A/J wild-type diabetic mice. Results of RNA sequencing and subsequent analyses comparing TNC-KO diabetic mice to A/J diabetic mice. Panels (A), (B), and (C) display volcano plots of differential gene expression for three comparisons: (A) TNC-KO diabetic (dia) versus A/J non-diabetic (nondia) mice, B TNC-KO diabetic versus A/J diabetic (dia) mice, and (C) TNC-KO non-diabetic versus A/J non-diabetic comparison. In each plot, the x-axis represents the log₂ fold change (log2FC), and the y-axis shows the negative logarithm (base 10) of the adjusted p-value (-log10(p-value)). Genes significantly upregulated are indicated in red, and significantly downregulated genes are shown in blue, with horizontal dashed lines representing the significance. Panel (D) presents a pathway enrichment analysis conducted using Metascape for the TNC-KO diabetic versus A/J diabetic comparison, integrating KEGG and GO terms. The most significant pathways include “generation of precursor metabolites and energy,” “transport of small molecules,” and “energy reserve metabolic process,” indicating disruptions in metabolic pathways and transport mechanisms. Panel (E) shows pathway activity analysis, revealing significant upregulation of the JAK-STAT pathway and downregulation of the p53 pathway in TNC-KO diabetic mice, suggesting alterations in cytokine signaling and cell cycle regulation. Panel (F) illustrates transcription factor (TF) activity inferred from gene expression data, with transcription factors such as Rxra, Smad1, and Foxc2 displaying reduced activity, while Rrra and Nfe2l3 show increased activity in TNC-KO diabetic mice, implicating disrupted metabolic regulation and transcriptional control. Panel (G) depicts a hub gene analysis performed using Cytohubba. Genes are ranked based on their degree of connectivity, with hub genes shown on a continuum from red (highly connected) to yellow (moderately connected). At the same time, neighboring nodes are depicted in blue. Central hub genes, including Ppargc1b, Ndufs, and Sdha, which are involved in metabolic and mitochondrial processes, are highlighted, suggesting critical molecular interactions that may be impacted by TNC deficiency
Fig. 9
Fig. 9
Plasma levels of Tenascin-C (TNC) in patients. Plasma TNC levels in healthy subjects (n = 21) and patients with HFrEF with (n = 22) or without (n = 37) diabetes. Mean plasma level of TNC (pg/ml; SD) in control, HFrEF and diabetic HFrEF patients: 296.4 (159.7), 1237 (934.4) and 875.9 (682.6) pg/ml, respectively. One-way ANOVA with Bonferroni’s multiple comparison test: control versus HFrEF p < 0.0001, control versus HFrEF + DM p = 0.0402, HFrEF versus HFrEF + DM p = 0.2213. ANOVA, analysis of variance; DM, diabetes mellitus; HFrEF, heart failure with reduced ejection fraction; hTNC, human Tenascin-C. Mean ± SD are shown. **p < 0.01; *p < 0.05

References

    1. Saeedi P, Petersohn I, Salpea P, Malanda B, Karuranga S, Unwin N, Colagiuri S, Guariguata L, Motala AA, Ogurtsova K. Global and regional diabetes prevalence estimates for 2019 and projections for 2030 and 2045: results from the international diabetes federation diabetes atlas. Diabetes Res Clin Pract. 2019;157:107843. - PubMed
    1. WHO: Cause-specific mortality, 2000–2019. In.; 2020.
    1. Dal Canto E, Ceriello A, Rydén L, Ferrini M, Hansen TB, Schnell O, Standl E, Beulens JW. Diabetes as a cardiovascular risk factor: an overview of global trends of macro and micro vascular complications. Eur J Prev Cardiol. 2019;26(2):25–32. - PubMed
    1. Kannel WB, McGee DL. Diabetes and cardiovascular disease: the Framingham study. JAMA. 1979;241(19):2035–8. - PubMed
    1. Rubler S, Dlugash J, Yuceoglu YZ, Kumral T, Branwood AW, Grishman A. New type of cardiomyopathy associated with diabetic glomerulosclerosis. Am J Cardiol. 1972;30(6):595–602. - PubMed

MeSH terms