. 2025 May 31;23(1):257.
doi: 10.1186/s12964-025-02260-6.

The E3 ubiquitin ligase MARCH2 controls TNF-α mediated inflammation by autoubiquitination

Affiliations

The E3 ubiquitin ligase MARCH2 controls TNF-α mediated inflammation by autoubiquitination

Kiramage Chathuranga et al. Cell Commun Signal. .

Abstract

Background: Regulation of the nuclear factor-kappa B (NF-kB) signaling pathway is a major host homeostatic mechanism for controlling hyper-inflammation or chronic inflammation. Despite extensive research, the regulatory factors of NF-kB signaling required to preserve homeostasis and control inflammatory disorders are not fully understood. Moreover, the role of MARCH2 in chronic inflammation models and the regulation of MARCH2 activation remain to be elucidated.

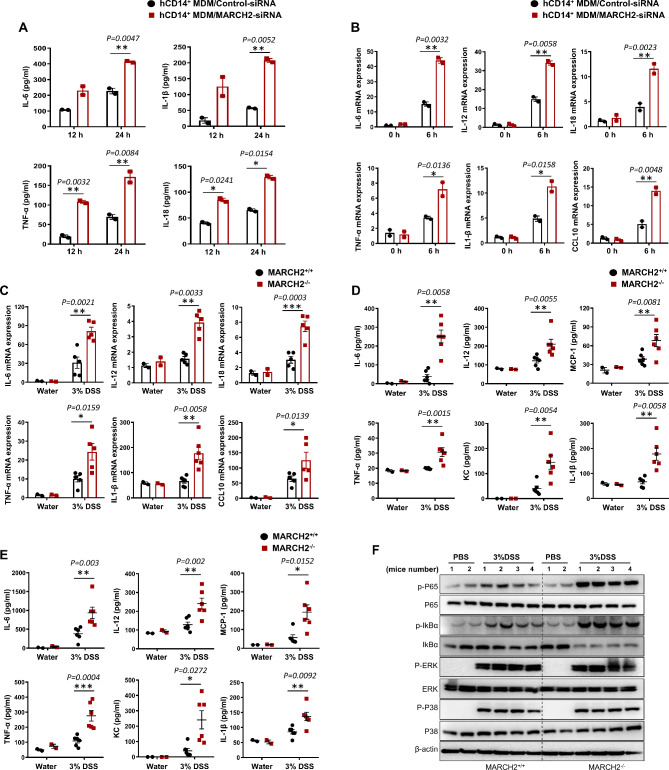
Methods: We monitored disease severity and mortality in MARCH2-/- or MARCH2+/+ mice induced experimental colitis. Susceptibility to DSS-induced experimental colitis was determined by various methods, including Swiss roll assay and fluorescein isothiocyanate (FITC)-dextran treatment, respectively. RNA-sequencing was conducted to recognize the inflammatory response-related genes in the distal colon of colitis-induced mice. Enzyme-linked immunosorbent assay (ELISA) was used to measure the cytokines and chemokines with in vitro and in vivo samples. Affinity purification and LC-MS/MS analysis were used to identify the MARCH2 interacting proteins and posttranslational modifications. The underlying mechanism was elucidated using immunoblotting, co-immunoprecipitation, ubiquitination assay, and confocal microscopy.

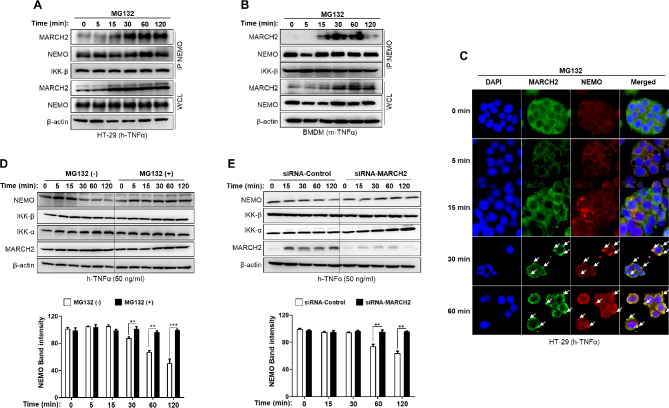
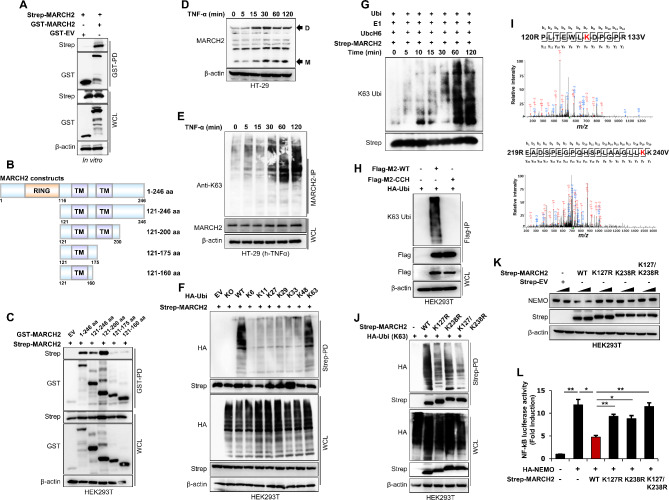
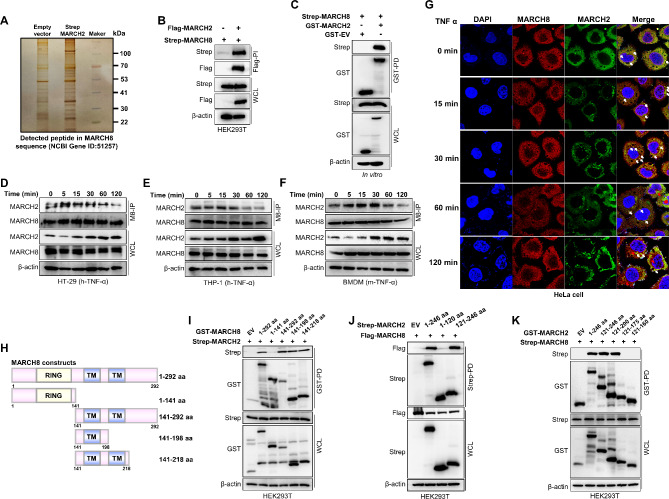
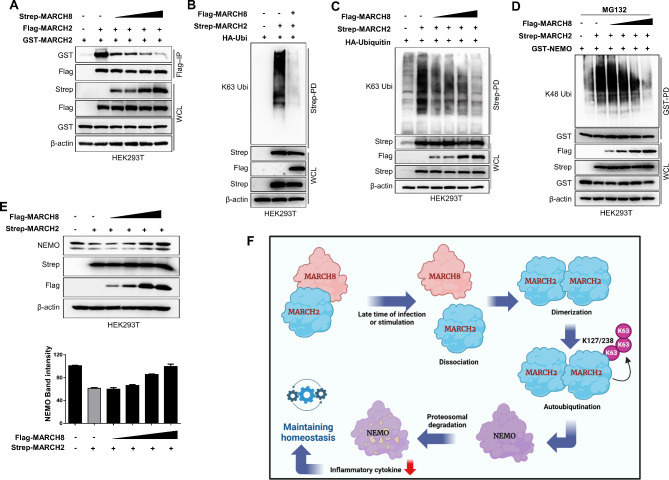
Result: Here, we report that MARCH2-/- mice were more susceptible to experimental inflammatory bowel disease (IBD) due to the massive production of cytokines. Stimulation by inflammatory cytokines such as TNF induces dimerization of MARCH2 at a later stage and dimerized MARCH2 undergoes K63-linked autoubiquitination at lysine 127 and 238, which promotes NEMO recognition, ubiquitination and proteasomal degradation. We also show an interaction between MARCH2 and MARCH8 in resting cells that inhibits MARCH2 activation. Taken together, these findings provide new insights into the molecular mechanism of MARCH2 and suggest a crucial role of MARCH2 in the modulation of inflammation and cellular homeostasis.

Conclusion: Our results indicate that MARCH2 plays a critical role in regulating NEMO/IKKγ under the inflammatory and resting conditions, thereby suppressing excessive or unexpected inflammatory responses. Our findings here not only demonstrate a biological role of MARCH2 in inflammatory signaling pathways but also provide a novel insight in the underlying mechanism.

Keywords: Autoubiquitination; Dimerization; IBD; MARCH2; MARCH8.


Conflict of interest statement

Declarations. Competing interests: The authors declare no competing interests.

Figures

Fig. 1
Fig. 1
Increased susceptibility of MARCH2−/− mice to dextran sulfate sodium (DSS)-induced colitis. (A) Top: A schematic representation of the experimental design is shown. Bottom: The survival rates of MARCH2+/+ (n = 13, black circle) and MARCH2−/− (n = 13, Red square) mice after treatment with 3% DSS are presented as percentages, and survival differences between the groups were analyzed via the log-rank t-test. ****P < 0.0001. (B) The body weights of MARCH2+/+ (n = 13) and MARCH2−/− (n = 13) mice after treatment with 3% DSS are presented as percentages of the starting weight of each mouse. Statistical significance was determined via Student’s t test. *P < 0.05. C-D. Bleeding score and stool score was analyzed at each day following DSS treatment. MARCH2+/+ (n = 6) and MARCH2−/− (n = 6) mice at 5 days after treatment with 3% DSS. The Control group was treated with normal drinking water instead of DSS. E. Colon length was estimated for MARCH2+/+ (n = 6) and MARCH2−/− (n = 6) mice at 5 days after treatment with 3% DSS. Control group was treated with normal drinking water instead of DSS. F. Representative images of Swiss roll mounts of mouse colons from MARCH2+/+ and MARCH2−/− mice on day 7 of 3% DSS treatment. The right panels show magnified views of the boxed areas in the left panels. Scale bars, 50 mm. G. Representative images of Ki67, immunostaining in distal colon of MARCH2+/+ and MARCH2−/− mice 7 days after cessation of 3% dextran sulfate sodium (DSS) treatment. H. PAS staining of colon samples from the distal end of the colon from MARCH2+/+ (n = 4) and MARCH2−/− (n = 4) mice at 3, 5 and 7 days after treatment with 3% DSS. The number of mature goblet cells containing large mucosal granules was markedly decreased compared with that in WT mice. Representative PAS staining are shown. I. Intestinal permeability was determined by oral administration of FITC-dextran on the 4 and 7 days of 3% DSS treatment. FITC-dextran level in sera is shown. *P < 0.05, **P < 0.01, ***P < 0.001, ****P < 0.0001 (two-tailed Student’s t-test). Data are expressed as the mean ± SEM
Fig. 2
Fig. 2
MARCH2−/− mice show rapid immune activation in DSS-induced colitis. MARCH2+/+ and MARCH2−/− mice were treated with normal drinking water or 3% DSS. On day 5, colon tissue was isolated, and mRNA was prepared (n = 2 per group). Total RNA was used for the preparation of the sequencing libraries using the Illumina Trueseq RNA Sample Prep Kit, and the sequencing was performed on a Hiseq4000. RNA-seq reads were aligned to the mouse mm10 genome. A Volcano plot of differentially expressed genes (DEGs) identified in the comparison between (Left panel) untreated MARCH2−/− and MARCH2+/+ mice and (Right panel) DSS-treated MARCH2−/− and MARCH2+/+ mice. The black dot represents genes without different expression levels between groups. Red dots represent upregulated genes, and green dots represent downregulated genes B. Heatmap of DEG relevant to inflammatory responses (Gene count: 99) in the comparison of DSS-treated MARCH2−/− and MARCH2+/+ mice. Red and blue colours represent the upregulated and downregulated genes, respectively. (Fold change > 2, Normalized data (log2) 2, and p value < 0.05) C. Gene ontology annotation. The top 10 terms in biological process (BP) are shown in the comparison of DSS-treated MARCH2−/− and MARCH2+/+ mice. D. The bubble plot presents the nominal p values and false discovery rates of the top 10 correlated genes in the comparison of DSS-treated MARCH2−/− and MARCH2+/+ mice. E. Gene network shows interaction between inflammatory related upregulated and down regulated genes in the comparison of DSS-treated MARCH2−/− and MARCH2+/+ mice. The size of a node indicates the number of correlated nodes
Fig. 3
Fig. 3
Loss of MARCH2 produced more inflammatory cytokines A-B. Human CD14 + monocyte-derived macrophage (hCD14 + MDM) cells were transfected with control-siRNA or MARCH2-siRNA and were treated with hTNF-α for the indicated time. Secretion of cytokine was measured by the ELISA (A), and gene transcription was analyzed by RT-PCR assay (B). C. Expression levels of genes encoding cytokines, such as IL-1β, IL-6, TNF-α, and IL-10, IL-12, IL-18, CCL10, IL-4 were estimated in the colon of MARCH2+/+ (n = 5, black) and -KO (n = 5, Red) mice at 5 days after DSS treatment. mRNA levels are presented relative to those in WT control mice. D. Distal colon samples were collected at 7 days following oral inoculation of 3% DSS in drinking water. Cytokine secretion was analyzed in 1 g of colon homogenate by ELISA E. Serum samples were collected at 7 days following oral inoculation of 3% DSS in drinking water to MARCH2+/+ or MARCH2−/− mice. Cytokine or chemokine secretion was analyzed in the MARCH2−/− and MARCH2+/+ mice serum by ELISA. F. Signaling pathways regulated by MARCH2 in the colon tissues. The active phosphorylation of P65, IKBα, P38 in the colon from MARCH2+/+ and MARCH2−/− mice at 5 days after treatment with 3% DSS were determined by immunoblotting using specific antibodies against the indicated proteins and phosphorylated forms based on density. *P < 0.05, **P < 0.01, ***P < 0.001 (two-tailed Student’s t-test). Data are expressed as the mean ± SEM
Fig. 4
Fig. 4
MARCH2 interacts with NEMO in response to TNF-α stimulation. A-B. HT-29 cells or BMDM cells isolated from wild-type C57BL/6 mice were treated with recombinant TNF-α for indicated time points in the presence of MG-132 and sampled for immunoprecipitation analysis. Whole-cell lysates were subjected to immunoprecipitation with anti-NEMO antibody, followed by immunoblotting with anti-MARCH2 and anti-NEMO antibodies. Whole-cell lysates were analyzed with anti-MARCH2, anti-NEMO, and anti-β-actin antibodies. C. HT-29 cells were treated with recombinant TNF-α for indicated time point in the presence of MG-132. MARCH2 was detected with an anti-MARCH2 antibody and labeled with a FITC-conjugated antibody by green signals, while NEMO was detected with an anti-NEMO antibody and Cy3-conjugated antibody by red signals. Nuclei were stained with DAPI (blue), and co-localization is marked with white arrows. D. HT-29 cells were treated with recombinant TNF-α for indicated time point in the presence or absence of MG-132 and sampled for immunoprecipitation analysis. Whole-cell lysates were analyzed with anti-MARCH2, anti-NEMO, IKK-a, IKK-b and anti-β-actin antibodies (Top panel). NEMO protein level was quantified by densitometry and normalized to β-actin levels. E. MARCH2 knockdown or control cells were treated with recombinant TNF-α for indicated time points in the presence or absence of MG-132 and sampled for immunoprecipitation analysis. Whole-cell lysates were analyzed with anti-MARCH2, anti-NEMO, IKK-a, IKK-b and anti-β-actin antibodies (Top panel). NEMO protein level was quantified by densitometry and normalized to β-actin levels. **P < 0.01, ***P < 0.001 (two-tailed Student’s t-test). Data are representative of at least two independent experiments, each with similar results
Fig. 5
Fig. 5
MARCH2 dimerization followed by autoubiquitination is important for MARCH2 activation. (A) In vitro binding assay. HEK293T cells were transfected with Strep-tagged MARCH2 or GST-tagged MARCH2 or GST empty vector. Purified protein was prepared following immunoprecipitation. Strep-tagged MARCH2 was co incubated with GST-tagged MARCH2 or GST-empty vector followed by pulldown with GST beads. (B) Schematic representations of the detailed domain constructs of MARCH2 (C) HEK293T cells were transfected with Strep-tagged MARCH2 and GST-tagged MARCH2 domain constructs for 36 h. GST pulldown assay was performed, followed by immunoblotting with an anti-Strep antibody. Whole-cell lysates were analyzed with anti-GST and anti- Strep antibodies. (D) Endogenous MARCH2 dimerization assay. HT-29 cells were treated with TNF-α for indicated time points. The whole cell lysate was analyzed by native page gel western blotting or SDS buffer containing gel electroporation. (E) MARCH2 autoubiquitination was assessed in HT-29 cells. HT-29 cells were treated with TNF-α for indicated time points. Cell lysates were subjected to immunoprecipitation with an anti-MARCH2 antibody, followed by immunoblotting with an anti-K63 ubiquitin antibody. Whole-cell lysates were analyzed with anti-MARCH2 antibody. (F) HEK293T cells transfected with Strep-tagged empty vector or MARCH2 with each different HA-tagged ubiquitin mutants (indicated lysine (K) only, other lysines (K) mutated to arginine (R). Lysates were subjected to pull-down with Strep beads, followed by immunoblotting with an anti-HA antibody. Whole-cell lysates were determined by immunoblotting with the indicated antibodies. (G) Time-dependent In-vitro ubiquitination assay for MARCH2. HEK293T cells were transfected with Strep-tagged MARCH2. Immunoprecipitates were incubated with a reaction mixture containing ubiquitin, E1, and UbcH6 (E2), followed by immunoblotting with an anti-K63-linkage specific polyubiquitin antibody. (H) HEK293T cells transfected with Flag-tagged empty vector, MARCH2 or MARCH2CCH together with HA-tagged ubiquitin were subjected to pull down with flag antibody, followed by immunoblotting with anti-K63-ubi antibody. Whole-cell lysates were determined by immunoblotting with the indicated antibodies. (I) HEK293T cells were transfected with strep-tagged MARCH2 or Strep-tagged empty vector. Whole-cell lysates were subjected to strep PD, and samples were run through 4–12% Bis-Tris gel. The gel was stained using coomassie blue stain, and the upper part of the MARCH2 protein band was separated and subjected to post-translational modification analysis. (J) HEK293T cells transfected with HA-tagged K63-ubiquitin and Strep-tagged MARCH2 mutants (K127R, K238R or K127/238R) together with Strep-tagged empty vector were subjected to pulldown with Strep beads, followed by immunoblotting with anti-HA, or anti-Strep antibody. Whole-cell lysates were determined by immunoblotting with the indicated antibodies. K. HEK293T cells were transfected with Strep-tagged empty vector, Strep-tagged MARCH2-WT and its point mutants in dose-dependent manner. Lysates were subjected to immunoblotting with anti-NEMO and anti-Strep antibodies. L. HEK293T cells were transfected with a firefly luciferase reporter plasmid encoding the NF-κB promoter plus a TK renilla plasmid and Strep-tagged empty vector, Strep-tagged MARCH2-WT and its point mutants for 24 h. Results are expressed relative to those of renilla luciferase alone (Internal control). *P < 0.05, **P < 0.01, ***P < 0.001 (two-tailed Student’s t-test). Data are representative of at least two independent experiments, each with similar results
Fig. 6
Fig. 6
MARCH2 interacts with MARCH8. (A) MARCH2 Silver staining for MARCH2 interactome assay. (B) HEK293T cells transfected with Flag-tagged empty vector or MARCH2 together with Strep-tagged MARCH8 were subjected to flag immune precipitation, followed by anti-Strep antibody western blot. Whole-cell lysates were determined by immunoblotting with anti-Strep, anti-Flag or anti-β-actin antibody. C-F. Interaction between MARCH2 and MARCH8. HEK293T cells were transfected with strep-tagged MARCH8 and GST tagged-MARCH2 or empty vector (C) or HT-29 cells (D) THP-1 cells (E), BMDM cells (F) were treated with TNF-α in a time-dependent manner. Cell lysates were subjected to immunoprecipitation with an anti-MARCH8 antibody, followed by immunoblotting with an anti-MARCH2 antibody. G. Confocal microscopy was conducted to examine time-dependent colocalization of MARCH2 (Green) and MARCH8 (red) in HeLa cells upon TNF-α treatment. H. Schematic representation of Strep-MARCH8 construct. I. HEK293T cells were transfected with Strep-tagged MARCH2 and GST-tagged MARCH8 constructs for 36 h. GST pulldown assay was performed, followed by immunoblotting with an anti-Strep antibody. Whole cell lysates were analyzed with anti-GST and anti-Strep antibodies. J. HEK293T cells were transfected with Flag-tagged MARCH8 and Strep-tagged MARCH2 constructs for 36 h. Strep pulldown assay was performed, followed by immunoblotting with an anti-Flag antibody. Whole cell lysates were analyzed with anti-GST and anti-Strep antibodies. K. HEK293T cells were transfected with Strep-tagged MARCH8 and GST-tagged MARCH2 detailed domains for 36 h. GST pulldown assay was performed, followed by immunoblotting with an anti-Flag antibody. Whole-cell lysates were analyzed with anti-Flag and anti-Strep antibodies. Data are representative of at least two independent experiments, each with similar results
Fig. 7
Fig. 7
MARCH8 interaction inhibits the MARCH2 dimerization and autoubiquitination. (A) HEK293T cells were co-transfected with control vector (Flag), Flag-MARCH2, GST-MARCH2, and increasing doses of Strep-tagged MARCH8 plasmid. The cell lysates were subjected to Flag-IP and subsequent immunoblotting with anti-GST, anti-Flag antibodies. Further, WCL was immunoblotted with anti-Flag, anti-Strep, and anti-GST antibodies. (B) Immuno-precipitation assay was conducted to examine the MARCH2 autoubiquitination inhibition by MARCH8. HEK293T cells were transfected with HA-Ubiquitin, Strep-tagged MARCH2 with or without Flagg-tagged MARCH2 plasmids for 36 h. The cell lysates were subjected to Strep-PD and subsequent immunoblotting with anti-K63 specific ubiquitin antibody or anti-strep antibody. Further, WCL was immunoblotted with anti-Flag, and anti-Strep antibodies. (C) HEK293T cells were co-transfected with the control vector (Strep), Strep-MARCH2, HA-ubiquitin, and increasing doses of Flag-tagged MARCH8 plasmid. The cell lysates were subjected to Strep-PD and subsequent immunoblotting with anti-K63 specific ubiquitin antibody, anti-Strep antibody. Further, WCL was immunoblotted with anti-Flag and anti-Strep, antibodies. (D) HEK293T cells were co-transfected with control vector (Strep), Strep-MARCH2, GST-NEMO, and increasing doses of Flag-tagged MARCH8 plasmid in the presence of MG-132. The cell lysates were subjected to GST-PD and subsequent immunoblotting with anti-K48 specific ubiquitin antibody, anti-GST antibody. Further, WCL was immunoblotted with anti-Flag, anti-GST, and anti-Strep, antibodies. (E) MARCH8 inhibits MARCH2-mediated NEMO degradation. HEK293T cells were transfected with strep-tagged MARCH2 and dose-dependently increasing amount of flag-tagged MARCH2 plasmid. The cell lysate was immunoblotted with anti-NEMO, anti-strep, and anti-flag antibodies (Top panel). NEMO protein level was quantified by densitometry and normalized to β-actin levels (Below panel). (F) Graphical illustration of the mechanism study: MARCH2 and MARCH8 proteins exist in a complex under normal cellular conditions. Upon stimulation, MARCH8 dissociates from the complex, allowing the dimerization of MARCH2 and MARCH2 K63-linked autoubiquitination at lysines 127 and 238. Autoubiquitinated, activated MARCH2 binds to NEMO and targets the protein for proteasomal degradation via K48-linked polyubiquitination. Data are representative of at least two independent experiments, each with similar results

References

    1. Cockram PE, Kist M, Prakash S, Chen SH, Wertz IE, Vucic D. Ubiquitination in the regulation of inflammatory cell death and cancer. 2021;28(2):591–605. - PMC - PubMed
    1. Ruan J, Schlüter D, Naumann M, Waisman A, Wang X. Ubiquitin-modifying enzymes as regulators of colitis. Trends Mol Med. 2022;28(4):304–18. - PubMed
    1. Behera A, Sachan D, Barik GK, Reddy ABM. Role of MARCH E3 ubiquitin ligases in cancer development. Cancer Metastasis Rev 2024;1–21. - PubMed
    1. Nathan JA, Lehner PJ. The trafficking and regulation of membrane receptors by the RING-CH ubiquitin E3 ligases. Exp Cell Res. 2009;315(9):1593–600. - PubMed
    1. Chathuranga K, Kim TH, Lee H, Park JS, Kim JH, Chathuranga WAG. Negative regulation of NEMO signaling by the ubiquitin E3 ligase MARCH2. 2020;39(21):e105139. - PMC - PubMed

Substances

LinkOut - more resources