. 2025 Jun 24;44(6):115778.
doi: 10.1016/j.celrep.2025.115778. Epub 2025 May 30.

Landscape and regulation of mRNA translation in the early C. elegans embryo

Affiliations

Landscape and regulation of mRNA translation in the early C. elegans embryo

Yash Shukla et al. Cell Rep. .

Abstract

Animal embryos rely on regulated translation of maternally deposited mRNAs to drive early development. Using low-input ribosome profiling combined with RNA sequencing on precisely staged embryos, we measure mRNA translation during the first four cell cycles of C. elegans development. We uncover stage-specific patterns of developmentally coordinated translational regulation. Our results confirm that mRNA localization correlates with translational efficiency, though initial translational repression in germline precursors occurs before P-granule association. Our analysis suggests that the RNA-binding protein OMA-1 represses the translation of its target mRNAs in a stage-specific manner while indirectly promoting the translational efficiency of other transcripts. These findings illuminate how post-transcriptional mechanisms shape the embryonic proteome to direct cell differentiation, with implications for understanding similar regulation across species where maternal factors guide early development.

Keywords: C. elegans; CP: Developmental biology; CP: Molecular biology; OMA-1; P granules; Ribo-ITP; cell fate determination; embryogenesis; mRNA translation; maternal transcripts; post-transcriptional control; ribosome profiling; translational regulation.


Conflict of interest statement

Declaration of interests The authors declare that they have no competing interests related to this work.

Figures

Figure 1.
Figure 1.. Low-input RNA-seq and ribosome profiling
(A) Adult C. elegans were dissected to obtain embryos at the one-, two-, four-, and eight-cell stages, which were then subjected to ribosome profiling (Ribo-ITP) and RNA-seq analysis. (B) Mapping of ribosome profiling reads to different genomic features (CDS, 5 UTR, and 3 UTR) is presented for each stage. Error bars indicate the standard deviation. (C) Ribosome occupancy around the translation start and stop sites in a representative one-, two-, four-, and eight-cell-staged embryo. Translation start (or stop) sites are denoted by the position 0. Aggregated read counts (y axis) relative to the start (or stop) sites are plotted after A-site correction. (D–G) Hexbin plots illustrating pairwise correlations of ribosome profiling data between representative replicates across developmental stages. Each axis displays log-scaled counts per million (CPM) of detected genes. The Spearman correlation is indicated in the left corner of the plots. Darker orange color indicates high density of points. (H–K) Pairwise correlation between ribosome occupancy and RNA abundance at the four stages of early C. elegans embryo development is presented. The mean CPM of ribosome occupancy is plotted against the mean CPM of RNA abundance at each stage. ρcor is the corrected Spearman correlation based on the reliability r (RNA) and r (Ribo), which is the replicate-to-replicate correlation (STAR Methods).
Figure 2.
Figure 2.. Stage-specific patterns of translational regulation in early embryogenesis
(A–C) Mean difference plots comparing gene expression between sequential C. elegans embryonic stages (A) one to two cells, (B) two to four cells, and (C) four to eight cells. The log2 fold change in RNA abundance and translational efficiency (y axis) is plotted against the mean of normalized counts (x axis). Blue density plots represent the overall distribution of genes, with the intensity corresponding to the density of points. The orange points indicate transcripts with significant expression changes (FDR <0.2 and log2FC > 1 or < −1). (D) Scatterplot comparing the log2 fold change in ribosome occupancy against RNA abundance for genes with significantly altered translational efficiency. The color gradient represents the corresponding translational efficiency for each gene.
Figure 3.
Figure 3.. Functional clustering reveals developmentally coordinated translational programs
k-means clustering was performed on normalized TE values for all genes, with data centered by subtracting the mean TE across all stages for each gene. This analysis yielded nine distinct clusters. (A) The line plot displays one-cell-stage subtracted TE values (y axis) across developmental stages (x axis). Clusters are color coded based on broad TE patterns: blue for repression and red for activation. Error bars in red represent the standard error of TE values for all genes within each cluster. (B) Line plot showing the centered log ratio of ribosome occupancy (orange) and RNA abundance (blue) at developmental stages relative to the one-cell stage. (C) The dot plot visualizes Gene Ontology (GO) enrichment analysis for the identified clusters. The y axis shows enriched GO terms, while the x axis represents clusters. Dot size indicates enrichment ratio, and color intensity reflects the adjusted p value of enrichment.
Figure 4.
Figure 4.. P-granule localization occurs after translational repression
(A) Violin plots illustrating the distribution of normalized translational efficiency for transcripts enriched in somatic and germline precursor cells (enrichment data from Tintori et al.) of early C. elegans embryos. The width of each violin represents the probability density of efficiency values. Median normalized translational efficiency is indicated by a dot, with error bars showing the first (Q1) and third (Q3) quartiles. (B) Line plot showing the mean normalized translational efficiency of transcripts localized in the cell periphery and P granules (based on single molecule fluorescence in situ hybridization data from Parker et al. and Winkenbach et al.) across embryonic stages from one to eight cells. This plot compares the translational efficiency trends of these two transcript populations throughout early embryonic development. (C) Translational efficiency relative to one-cell stage for transcripts that transition into P granules (P granule localization identified in Scholl et al.). Orange line shows transcripts that first appear in P granules at the four-cell stage (n = 81), brown line shows transcripts first appearing at eight-cell stage (n = 43). Error bars represent standard error of the mean. (D) Translational efficiency of P-granule transcripts based on their maintenance in primordial germ cells (Z2/Z3). Group I transcripts remain associated with P granules through primordial germ cell development (n = 163), while group II transcripts show transient P-granule association (n = 277) (localization identified in Scholl et al.). Violin plots show the distribution of translational efficiency values, with median and quartiles indicated. Asterisks denote statistical significance between groups (*p < 0.05, **p < 0.01, and ***p < 0.001, Wilcoxon rank-sum test).
Figure 5.
Figure 5.. OMA-1 regulates translational efficiency in a stage-specific manner
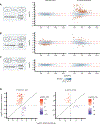
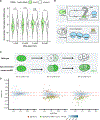
(A) Violin plots to illustrate the distribution of normalized translational efficiency for OMA-1-bound (green) and unbound (white) transcripts (as identified by Spike et al.) across four early C. elegans embryonic stages (one cell, two cells, four cells, and eight cells), identified from previous OMA-1-associated RNA microarray data. The width of each violin represents the probability density of efficiency values. Median normalized translational efficiency is indicated by a dot, with error bars showing the first (Q1) and third (Q3) quartiles. (B) Schematic diagram depicting OMA-1’s regulatory mechanism in early embryogenesis, showing OMA-1 inhibiting translation of maternal transcripts at the one-cell stage, followed by its degradation by the four-cell stage, which allows translation of previously repressed transcripts. (C) The difference in OMA-1 degradation between wild-type and zu405 mutant embryos is illustrated. (D) A pairwise comparison of translational efficiency between wild-type and mutant at each stage. This is represented as log2 fold change in translational efficiency (y axis) against the mean of normalized counts (x axis). A blue density plot represents the overall distribution of genes, with intensity corresponding to point density. Orange points indicate transcripts with significant expression changes (FDR <0.2), while green points highlight known OMA-1-bound transcripts (as identified by Spike et al.) with significant changes in translational efficiency.
Figure 6.
Figure 6.. Failure of translational remodeling in oma-1(zu405) reveals diverse regulatory mechanisms
(A) Mean difference plot showing changes in TE between one- and two-cell stages in zu405 mutant embryos. The log2 fold change in TE (y axis) is plotted against the mean of normalized counts (x axis). (B) Scatterplot comparing log2 fold changes in TE between zu405 mutant (y axis) and wild type (x axis) for genes significantly changed in both genotypes during the one-cell to two-cell transition. Points in green indicate known OMA-1-bound transcripts. (C) Mean difference plot depicting TE changes between two- and four-cell stages in zu405 mutant embryos, with log2 fold change in TE (y axis) plotted against mean normalized counts (x axis). (D) Scatterplot comparing log2 fold changes in TE between zu405 mutant (y axis) and wild type (x axis) for genes significantly changed in both genotypes during the two-cell to four-cell transition. Points in green indicate known OMA-1-bound transcripts. In all plots, the blue density overlay represents the overall distribution of genes, with intensity corresponding to the density of data points. The orange points indicate transcripts with significant expression changes (FDR <0.2 and Log2FC >1 or <−1)
Figure 7.
Figure 7.. Temporal clustering reveals diverse OMA-1-mediated translational regulation
(A) Line plot showing four clusters of OMA-1-bound transcripts identified based on changes in TE. The y axis represents TE values normalized to the one-cell stage, and the x axis shows developmental stages. Each line represents the mean TE trajectory for a cluster in both wild-type (black) and mutant embryos (green). Error bars represent the standard error of TE values for all genes within each cluster. (B) Dot plot visualizing Gene Ontology (GO) enrichment analysis for the four identified clusters. The y axis displays enriched GO terms, while the x axis shows the clusters. Dot size corresponds to the enrichment ratio and color intensity indicates the adjusted p value of enrichment.

Update of

References

    1. Tadros W, and Lipshitz HD (2009). The maternal-to-zygotic transition: a play in two acts. Development 136, 3033–3042. 10.1242/dev.033183. - DOI - PubMed
    1. Vastenhouw NL, Cao WX, and Lipshitz HD (2019). The maternal-to-zygotic transition revisited. Development 146, dev161471. 10.1242/dev.161471. - DOI - PubMed
    1. Winata CL, and Korzh V (2018). The translational regulation of maternal mRNAs in time and space. FEBS Lett. 592, 3007–3023. 10.1002/1873-3468.13183. - DOI - PMC - PubMed
    1. COPELAND PR, and WORMINGTON M (2001). The mechanism and regulation of deadenylation: Identification and characterization of Xenopus PARN. RNA 7, 875–886. 10.1017/s1355838201010020. - DOI - PMC - PubMed
    1. Simon R, Tassan JP, and Richter JD (1992). Translational control by poly(A) elongation during Xenopus development: differential repression and enhancement by a novel cytoplasmic polyadenylation element. Genes Dev. 6, 2580–2591. 10.1101/gad.6.12b.2580. - DOI - PubMed

MeSH terms

LinkOut - more resources