. 2025 Jun 1;15(1):19185.
doi: 10.1038/s41598-025-04113-1.

Leaf functional metabolic traits reveal the adaptation strategies of larch trees along the R/B ratio gradient at the stand level

Affiliations

Leaf functional metabolic traits reveal the adaptation strategies of larch trees along the R/B ratio gradient at the stand level

Xiaoqian Song et al. Sci Rep. .

Abstract

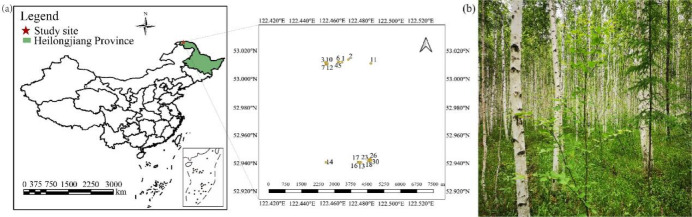
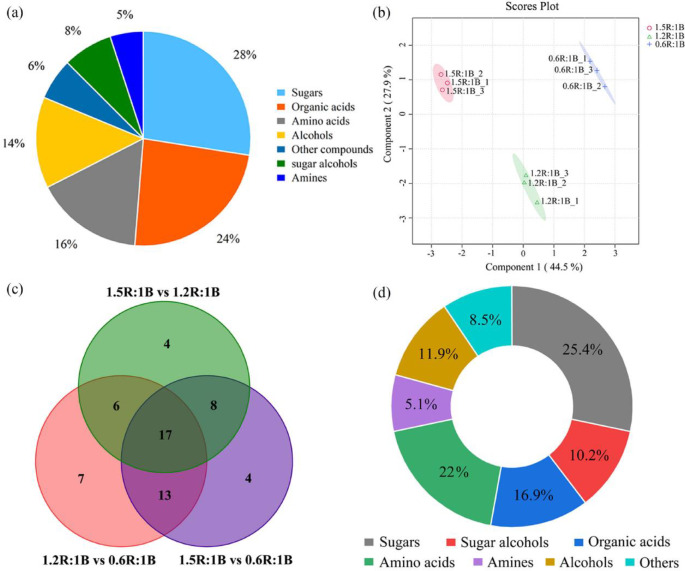
Light is crucial for understory sapling regeneration, and understanding leaf functional traits (LFT) is key to saplings' adaptation to different light conditions. Currently, how LFT vary with light quality heterogeneity is not well understood. This study aims to assess canopy-induced light heterogeneity and the adaptive strategies of larch saplings to it. The study classified the light environments of larch saplings into three types based on red-to-blue light ratios: 0.6R:1B, 1.2R:1B, and 1.5R:1B. As canopy openness (CO) increases and leaf area index decreases, the proportion of red light in the understory gradually rises. Saplings under the highest CO with a 1.5R:1B had lower leaf area but higher leaf dry matter, starch, carbon, and potassium contents. Metabolite analysis revealed that, under 1.5R:1B light conditions, the upregulation of sucrose synthase (SS) and sucrose-phosphate synthase (SPS) enzyme activities accelerated the consumption of maltose in leaves, led to the accumulation of ribitol and d-glucitol, and increased the levels of organic acids, thereby promoting the accumulation of flavonoids. These findings suggest that 0.6R:1B favors a resource acquisition strategy (rapid growth), while 1.5R:1B leans towards a resource conservation strategy (slow growth). This study provides a new perspective on the effects of light conditions on understory vegetation regeneration.

Keywords: Canopy structure; Economic traits; Light quality; Metabolic traits; Natural forest; Strategy.


Conflict of interest statement

Declarations. Competing interests: The authors declare no competing interests. Conflict of interest statement: The authors declare that they have no conflicts of interest. We confirm that all experimental studies and field surveys, including those involving cultivated and wild plants, were conducted by relevant guidelines, regulations, and legislation.

Figures

Fig. 1
Fig. 1
Location of the study area and information of the sampling points. (a) Location of the study area and information of the sample plots. (b) Diagram of the field site environment for larch survival.
Fig. 2
Fig. 2
Example of the hemispherical image, spectral feature cluster analysis, and its grouping. (a-c) Unprocessed canopy image; (d-f) canopy image after software analysis and processing. (a, d) is the canopy image under 0.6R: 1B light environment. (b, e) is the canopy image under 1.2R: 1B light environment. (c, f) is the canopy image under 1.5R: 1B light environment. (g) The 3 categories used in cluster analysis: 0.6R:1B is shown in black font, 1.2R:1B is shown in blue font, and 1.5R:1B is shown in red font. (h) Spectral characteristics under forest conditions.
Fig. 3
Fig. 3
Relationships between canopy structure, PAR, and R/B Ratio. (a) Canopy openness; (b) Leaf area index; (c) Transmitted total solar radiation.
Fig. 4
Fig. 4
Morphological characteristics of larch grown under different light environments (n = 50). (c) Specific leaf area; (d) Leaf dry matter content. *: p < 0.05; ***: p < 0.001; ****: p < 0.0001.
Fig. 5
Fig. 5
Histograms of the percentage of larch grown under different light environments per unit leaf area (n = 3). (a) C content per unit leaf area (%); (b) K content per unit leaf area (%); (c) Ca content per unit leaf area (%); (d) Mg content per unit leaf area (%); (d) Mn content per unit leaf area (%); (f) N content per unit leaf area (%). *: p < 0.05; **: p < 0.01; ***: p < 0.001; ****: p < 0.0001.
Fig. 6
Fig. 6
Differential distribution of key enzyme activities in larch leaf metabolites between different light environments (n = 3). (a) sucrose synthase (SS); (b) sucrose phosphate synthase (SPS); (c) sucrose invertase (INV); (d) phosphoenolpyruvate carboxylase (PEPC); (d) citrate synthase (CS); (f) L-phenylalanine ammonia-lyase (PAL). *: p < 0.05; **: p < 0.01; ***: p < 0.001; ****: p < 0.0001.
Fig. 7
Fig. 7
The primary differentially abundant metabolites of larch leaves under different light conditions were compared in pairs (n = 3). (a) Classification of 80 primary metabolites. (b) PLS-DA score plots; (c) Venn diagram shows the rich metabolites that are shared or unique and different; (d) Ring chart shows the classification of unique differential metabolites. With different coloured points and shapes representing different sample groups.
Fig. 8
Fig. 8
Heatmap visualization, Principal component analysis, and fold change in phenolic metabolites in larch leaves under different lighting conditions (n = 3). (a) Heatmap analysis of target phenolic metabolites; (b) PCA of target phenolic metabolites; (c-e) PCA of phenolic metabolites between different comparison groups; (f-h) FC of phenolic metabolites between different comparison groups. Orange represents the C6 C1 compound, purple represents the C6 C3 compound, and blue represents the C6 C3 C6 compound. Red indicates a high concentration of compounds; other colours indicate a low concentration (colour key scale above the heatmap); b: Red arrows and fonts represent major contributions to PC1, and blue arrows and fonts represent major contributions to PC2.
Fig. 9
Fig. 9
Association networks of metabolites and nutrients in larch leaves under different light conditions. (a) Correlation row network diagram, (b) MCC calculation score diagram. Nodes represent metabolites and elements, and edges represent correlations between them. Metabolites of the same class are shown in the same colour. Red lines indicate positive correlations, and blue lines indicate negative correlations. The node size reflects the number of edge line connections, and the edge line thickness reflects the strength of the correlation.
Fig. 10
Fig. 10
Comparison of changes in leaf metabolites in larch plants under different light conditions. The change in differentially metabolites is expressed as the ratio of log2 (FC). Blue indicates a decrease, and orange indicates an increase. The dashed and solid lines indicate indirect and direct connections, respectively. Arrows indicate the direction of the transformation. The three consecutive boxes represent the ratios of 1.2R:1B vs. 0.6R:1B, 1.5R:1B vs. 0.6R:1B, 1.5R:1B vs. 1.2R:1B. The red box represents an increase, and the blue box represents a decrease. The three rectangular boxes next to the arrow represent the FC ratio of metabolites, the rectangle next to the enzyme activity represents the FC ratio of enzyme activity, and the number inside represents the multiple of increase or decrease. Source of Fig. 10: Fig. 10 was created by one of the authors of this manuscript, Xiaoqian Song.

Similar articles

References

    1. Gendreau-Berthiaume, B. (ed Kneeshaw, D.) Influence of gap size and position within gaps on light levels. Int. J. Forestry Res.2009 581412 10.1155/2009/581412 (2009).
    1. Zhang, T., Yan, Q. L., Wang, J. & Zhu, J. J. Restoring temperate secondary forests by promoting sprout regeneration: effects of gap size and within-gap position on the photosynthesis and growth of stump sprouts with contrasting shade tolerance. For. Ecol. Manag. 429, 267–277. 10.1016/j.foreco.2018.07.025 (2018).
    1. Hertel, C., Leuchner, M. & Menzel, A. Vertical variability of spectral ratios in a mature mixed forest stand. Agric. For. Meteorol.151, 1096–1105. 10.1016/j.agrformet.2011.03.013 (2011).
    1. Navrátil, M., Špunda, V., Marková, I. & Janouš, D. Spectral composition of photosynthetically active radiation penetrating into a Norway Spruce canopy: the opposite dynamics of the Blue/red spectral ratio during clear and overcast days. Trees21, 311–320. 10.1007/s00468-007-0124-4 (2007).
    1. Wei, H. X., Chen, X., Chen, G. S. & Zhao, H. T. Foliar nutrient and carbohydrate in Aralia elata can be modified by understory light quality in forests with different structures at Northeast China. Ann. Res.62, 125–137. 10.15287/afr.2019.1395 (2019).

LinkOut - more resources