. 2025 May 1;26(3):bbaf249.
doi: 10.1093/bib/bbaf249.

EDS-Kcr: deep supervision based on large language model for identifying protein lysine crotonylation sites across multiple species

Affiliations

EDS-Kcr: deep supervision based on large language model for identifying protein lysine crotonylation sites across multiple species

Hong-Qi Zhang et al. Brief Bioinform. .

Abstract

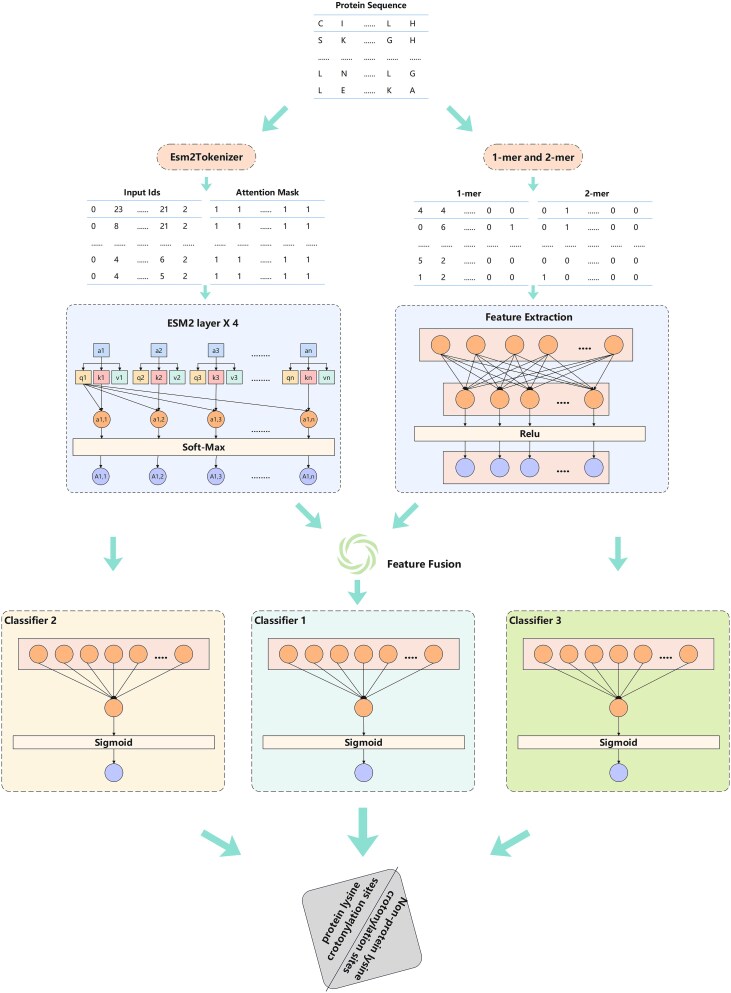
With the rapid advancement of proteomics, post-translational modifications, particularly lysine crotonylation (Kcr), have gained significant attention in basic research, drug development, and disease treatment. However, current methods for identifying these modifications are often complex, costly, and time-consuming. To address these challenges, we have proposed EDS-Kcr, a novel bioinformatics tool that integrates the state-of-the-art protein language model ESM2 with deep supervision to improve the efficiency and accuracy of Kcr site prediction. EDS-Kcr demonstrated outstanding performance across various species datasets, proving its applicability to a wide range of proteins, including those from humans, plants, animals, and microbes. Compared to existing Kcr site prediction models, our model excelled in multiple key performance indicators, showcasing superior predictive power and robustness. Furthermore, we enhanced the transparency and interpretability of EDS-Kcr through visualization techniques and attention mechanisms. In conclusion, the EDS-Kcr model provides an efficient and reliable predictive tool suitable for disease diagnosis and drug development. We have also established a freely accessible web server for EDS-Kcr at http://eds-kcr.lin-group.cn/.

Keywords: deep learning model; lysine crotonylation; post-translational modifications; protein language model; web server.


Figures

Figure 1
Figure 1
Data construction information diagram. ALT TEXT: Diagrams illustrating the data statistics across various species.
Figure 2
Figure 2
EDS-Kcr workflow overview diagram. ALT TEXT: Flowchart depicting the EDS-Kcr workflow, highlighting the main stages of the process, from data input through feature extraction, design of auxiliary tasks, and model output.
Figure 3
Figure 3
Model validation result diagram. A: Evaluation results of the model. B: ROC and PRC results of the model. C: t-SNE visualization of the model. ALT TEXT: Diagrams labeled A–C. A shows model evaluation results with various performance metrics. B displays the ROC and PRC curves for model performance, with annotated AUC and AUPRC values. C visualizes t-SNE clustering for model evaluation, highlighting data point separation.
Figure 4
Figure 4
Ablation experiment validation result diagram. A: Comparison chart of ACC results for ablation experiments. B: Comparison chart of F1 results for ablation experiments. C: Comparison chart of MCC results for ablation experiments. D: Comparison chart of AUC results for ablation experiments. ALT TEXT: Diagrams for ablation experiments labeled A–D. A compares ACC results for various ablation conditions. B compares F1 results for various ablation conditions. C compares MCC results for various ablation conditions. D compares AUC results for various ablation conditions.
Figure 5
Figure 5
Independent external verification result diagram. A: Bar chart for multispecies information assessment. B: Heatmap for multispecies information assessment. ALT TEXT: Bar chart and heatmap visualizing external verification results. A shows multispecies information assessment through a bar chart. B is a heatmap showing data from multiple species, with color gradients representing varying levels of assessed information.
Figure 6
Figure 6
Comparison with the latest methods result diagram. A: Detailed comparison with DeepCap-Kcr. B: Comparison with the AUC values of the latest models. C: ROC curve comparing with the DeepCap-Kcr. D: PRC curve comparing with the DeepCap-Kcr. ALT TEXT: Comparison graphs labeled A–D. A shows detailed comparison of the proposed model with DeepCap-Kcr, highlighting performance differences. B compares AUC values of the proposed model against recent methods. C displays ROC curve comparison between the proposed method and DeepCap-Kcr, with AUC annotations. D shows PRC curve comparison, highlighting differences in AUPRC performance.
Figure 7
Figure 7
Model interpretation display diagram. ALT TEXT: Diagram showing model interpretation, showing the interactions between amino acids at different positions.
Figure 8
Figure 8
A schematic of a web service. A: Home page. B: Submission page. C: Result page. D: Download page. ALT TEXT: Schematic showing web service interface, labeled A–D. A is the home page layout. B is the submission page interface. C displays the result page, showing data output. D shows the download page layout, enabling users to access and download data.

References

    1. Stevenin V, Neefjes J. Control of host PTMs by intracellular bacteria: an opportunity toward novel anti-infective agents. Cell Chem Biol 2022;29:741–56. 10.1016/j.chembiol.2022.04.004. - DOI - PubMed
    1. Chunyan Ao LY, Zou Q. Prediction of bio-sequence modifications and the associations with diseases. Brief Funct Genomics 2021;20:1–18. 10.1093/bfgp/elaa023. - DOI - PubMed
    1. Cheng H, Rao B, Liu L. et al. PepFormer: end-to-end transformer-based siamese network to predict and enhance peptide detectability based on sequence only. Anal Chem 2021;93:6481–90. 10.1021/acs.analchem.1c00354. - DOI - PubMed
    1. Jiang Y, Wang R, Feng J. et al. Explainable deep hypergraph learning modeling the peptide secondary structure prediction. Adv Sci 2023;10:2206151. - PMC - PubMed
    1. Liu T, Huang J, Luo D. et al. Cm-siRPred: predicting chemically modified siRNA efficiency based on multi-view learning strategy. Int J Biol Macromol 2024;264:130638. 10.1016/j.ijbiomac.2024.130638. - DOI - PubMed