. 2025 Aug;24(8):e70111.
doi: 10.1111/acel.70111. Epub 2025 Jun 1.

A Comprehensive Multiomics Signature of Doxorubicin-Induced Cellular Senescence in the Postmenopausal Human Ovary

Affiliations

A Comprehensive Multiomics Signature of Doxorubicin-Induced Cellular Senescence in the Postmenopausal Human Ovary

Pooja Raj Devrukhkar et al. Aging Cell. 2025 Aug.

Abstract

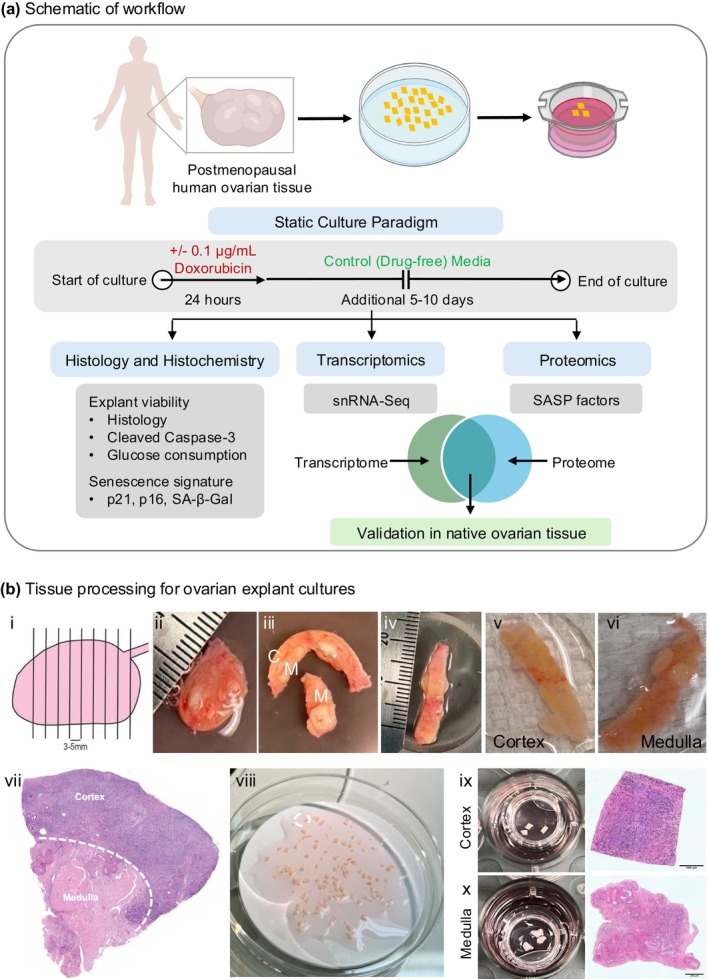
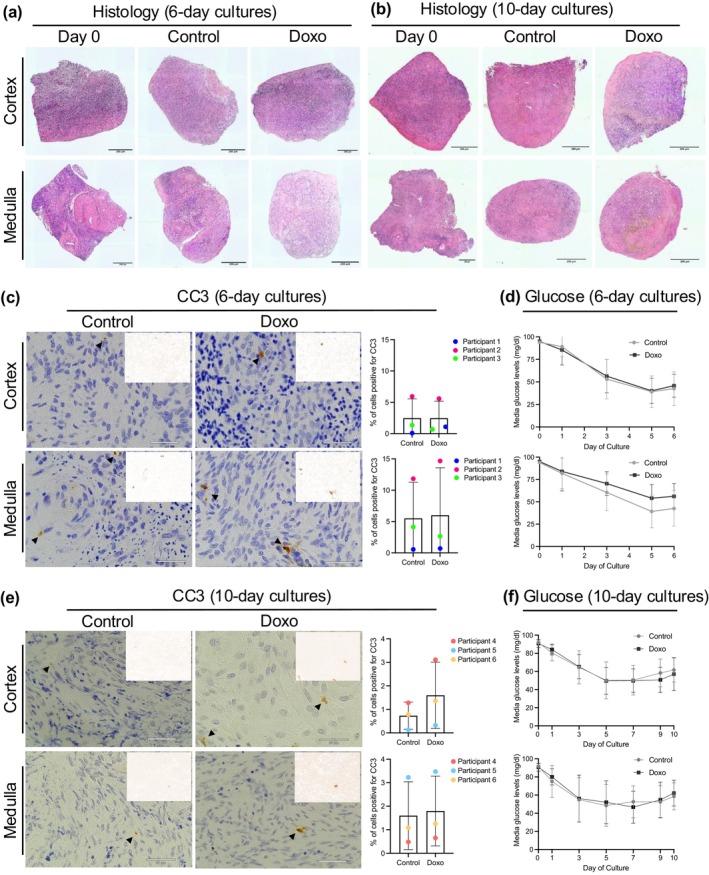
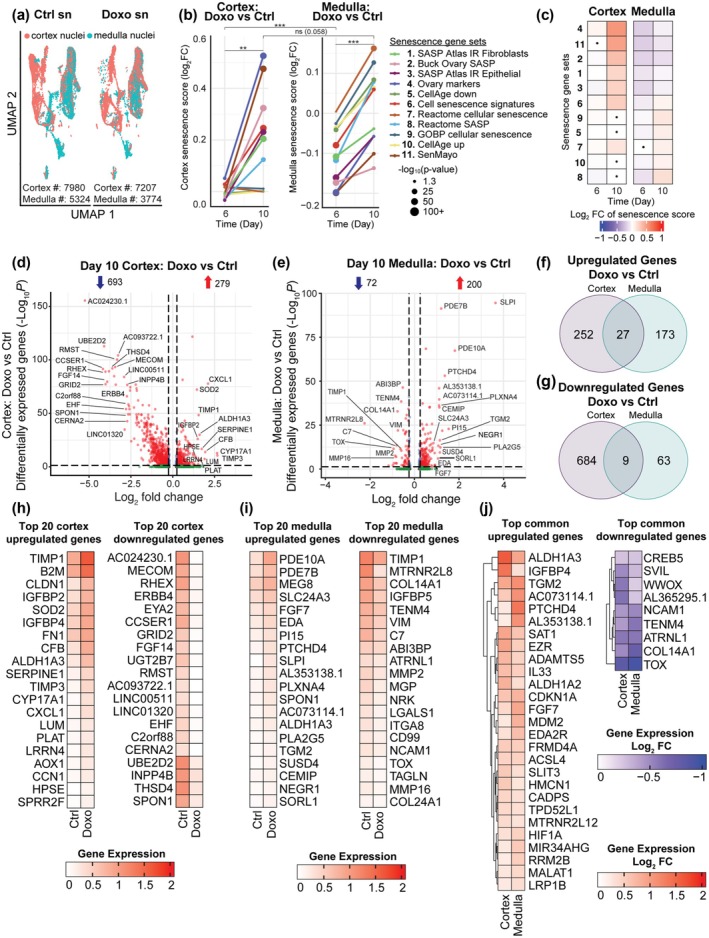
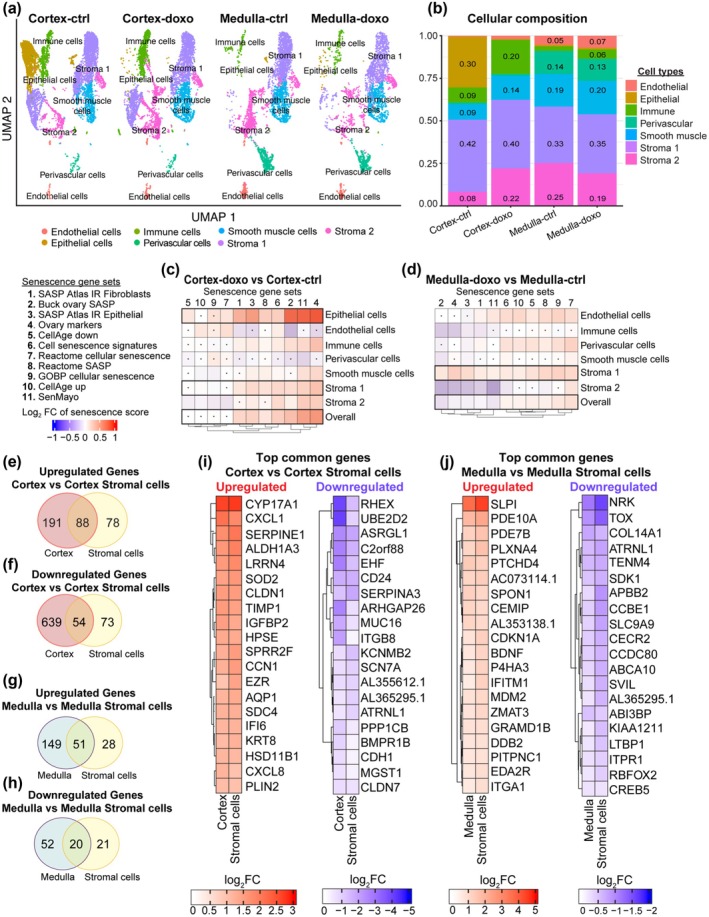
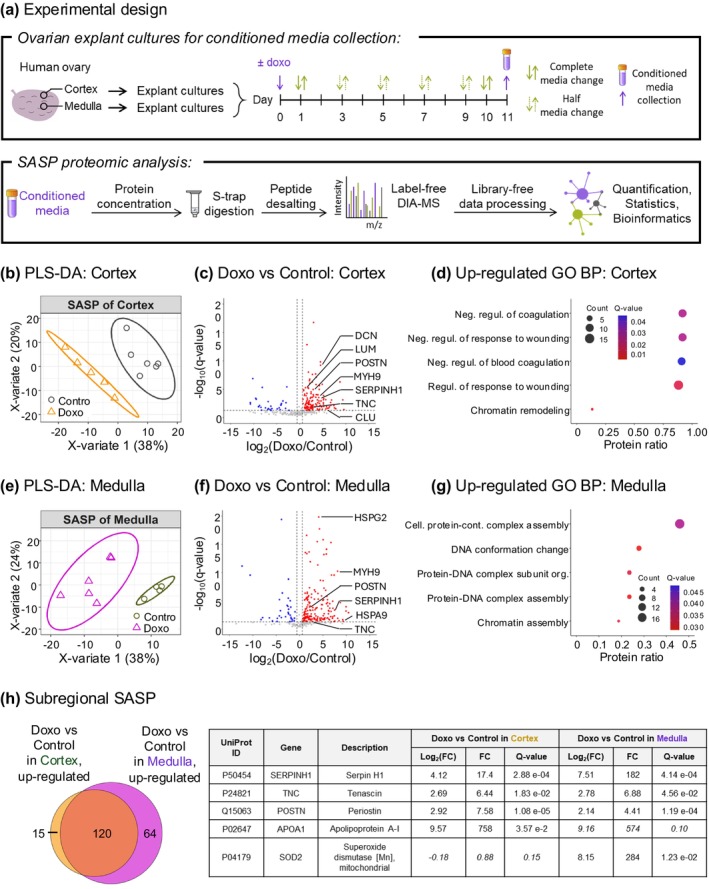
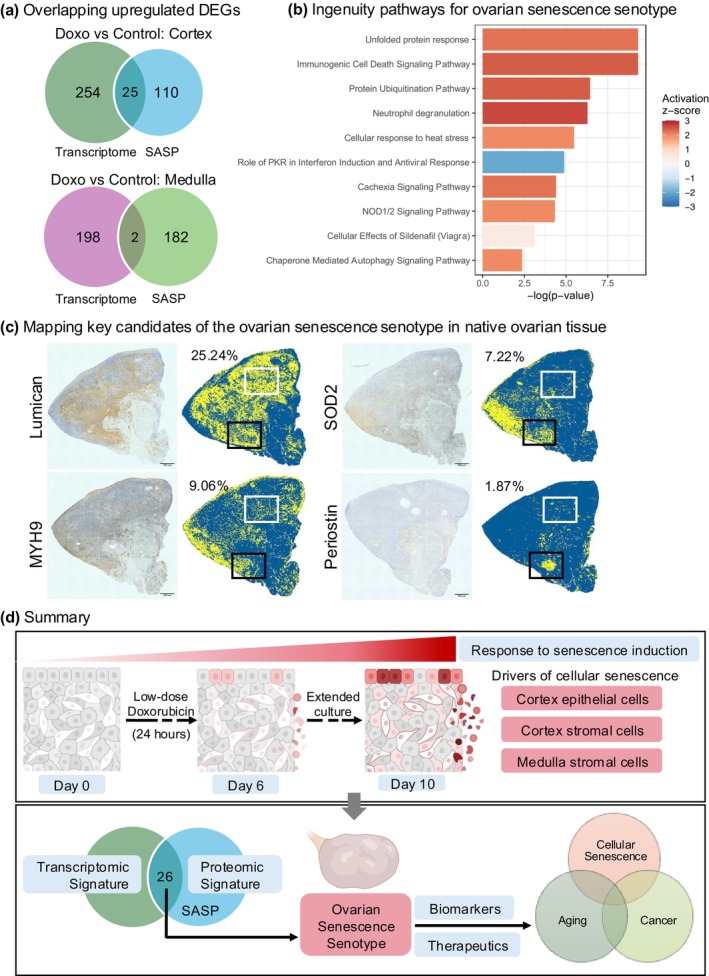
A major aging hallmark is the accumulation of cellular senescence burden. Over time, senescent cells contribute to tissue deterioration through chronic inflammation and fibrosis driven by the senescence-associated secretory phenotype (SASP). The human ovary is one of the first organs to age, and prominent age-related fibroinflammation within the ovarian microenvironment is consistent with the presence of senescent cells, but these cells have not been characterized in the human ovary. We thus established a doxorubicin-induced model of cellular senescence to establish a "senotype" (gene/protein signature of a senescence cell state) for ovarian senescent cells. Explants of human postmenopausal ovarian cortex and medulla were treated with doxorubicin for 24 h, followed by culture for up to 10 days in a doxorubicin-free medium. Tissue viability was confirmed by histology, lack of apoptosis, and continued glucose consumption by explants. Single nuclei sequencing and proteomics revealed an unbiased signature of ovarian senescence. We identified distinct senescence profiles for the cortex and medulla, driven predominantly by epithelial and stromal cells. Proteomics uncovered subregional differences in addition to 120 proteins common to the cortex and medulla SASP. Integration of transcriptomic and proteomic analyses revealed 26 shared markers, defining a senotype of doxorubicin-induced senescence unique to the postmenopausal ovary. A subset of these proteins: Lumican, SOD2, MYH9, and Periostin were mapped onto native tissue to reveal compartment-specific localization. This senotype will help determine the role of cellular senescence in ovarian aging, inform biomarker development to identify, and therapeutic applications to slow or reverse ovarian aging, senescence, and cancer.

Keywords: cellular senescence; explant tissues; ovarian aging; reproductive aging; senescence‐associated secretory phenotype SASP.


Conflict of interest statement

The authors declare no conflicts of interest.

Figures

FIGURE 1
FIGURE 1
Workflow and tissue processing for the doxorubicin‐induced model of cellular senescence in human postmenopausal ovarian explants. (a) Schematic detailing the workflow. Ovarian tissue was obtained from postmenopausal females, processed into explants, and cultured on transwells according to our static culture paradigm. Explants were assessed histologically for viability and senescence markers. Transcriptomics of cultured explants was performed using Single Nuclei Sequencing (snRNA‐Seq) and proteomics of conditioned media was performed to analyze SASP factors. A merged signature overlapping between the tissue transcriptome and conditioned media proteome was identified. Key candidates from the merged transcriptomic/proteomic signature were then mapped back onto native postmenopausal ovaries. (b) Tissue processing for ovarian explant cultures (i) Ovaries were sectioned into 3–5 mm thick slices, 1–2 of which are received in lab (ii). (iii) Ovarian sections were then processed into a smaller piece containing both cortex and medulla. (iv) The smaller piece was placed cortex –side –up on a Stadie‐Riggs tissue slicer to obtain 500 μm thin slices of the cortex (v) and medulla (vi). (vii) Shows a histological section of an ovarian piece with an outer cortex and inner medulla. (viii) The cortex and medulla slices were processed separately into 1 × 1 mm squares that were cultured as explants on transwells (ix and x; with corresponding histology of a cortex and medulla explant). Scale bars correspond to 200 μm.
FIGURE 2
FIGURE 2
Assessment of ovarian tissue explant viability after 6 and 10 days of culture. (a, b) H&E‐stained sections of human ovarian cortex and medulla explants cultured for 6 days (a) and 10 days (b) with 24 h doxorubicin exposure (0 or 0.1 μg/mL). Histology at Day 0, uncultured tissues is shown for comparison. Explants show no change in gross morphology, no signs of tissue necrosis, and show smoothened edges at 6 and 10 days indicative of wound healing and a healthy stroma (c) Immunohistochemistry for CC3 in the ovarian cortex and medulla explants on day 6 of culture showed low levels of cellular apoptosis (p value > 0.05). (d) Glucose levels measured in conditioned media of the cultured cortex and medulla explants on Days 0, 1, 3, 5, and 6 showed decreasing glucose levels in conditioned media, indicating glucose consumption by explants throughout 6 days of culture. Values are represented as a mean of 9 replicate wells per condition (N = 3 participants 61, 64, and 65 years old). (e) Immunohistochemistry for CC3 in the ovarian cortex and medulla explants on Day 10 of culture showed low levels of cellular apoptosis (p value > 0.05). (f) Glucose levels measured in conditioned media of the cultured cortex and medulla explants on Days 0, 1, 3, 5, 7, 9, and 10 show decreasing glucose levels in conditioned media, indicating glucose consumption by explants throughout 10 days of culture. Values are represented as a mean of 9 replicate wells per condition (N = 3 participants 50, 53, 62 years old). Insets: Color deconvoluted images highlighted DAB‐positive cells in brown color. Statistical significance was determined using an unpaired t‐test and p values < 0.05 were considered statistically significant.
FIGURE 3
FIGURE 3
snRNA‐seq highlights differences in senescence induction in ovarian cortex and medulla. (a) UMAP plot of single nuclei (sn) transcriptomes of explant ovarian tissue divided into cortex (pink) and medulla (green) after 10‐day treatment with doxorubicin (Doxo) or without doxorubicin (Ctrl). (b) Trajectory of cellular senescence scores across Days 6 and 10 in ovarian cortex and medulla tissue. x‐axis is the days postdoxo treatment. Y‐axis is the Log2FC of senescence scores in the doxo‐treated sample relative to the untreated control. The size of the dot is the –log10 transformed p value from two‐sided t‐test (p value Cortex Day 6 vs. Day 10 = 0.005804; Medulla Day 6 vs. Day 10 = 4.334e‐06; Cortex vs. Medulla Day 6 = 0.0009805; Cortex vs. Medulla Day 10 = 0.05816) (c) Heatmaps depicting senescence scores across the cortex and medulla over 6‐ and 10‐day doxo treatment. These scores were calculated using 11 gene sets associated with cellular senescence. The heatmap values represent log2 fold change of senescence scores in doxo‐treated cells relative to untreated controls. Nonsignificant differences are indicated with a dot. Statistical significance was assessed using two‐sided t‐test, with a threshold of p < 0.05. (d) A volcano plot of differentially expressed genes (DEGs) in Day 10 cortex (Doxo vs. Ctrl). DEGs (including Log2FC and p value) were calculated by the MAST method. The Benjamini–Hochberg method was used for multiple comparison adjustments. p value (adj. p) cutoff is < 0.05, and Log2FC cutoff is > 0.25. (e) A volcano plot of differentially expressed genes (DEGs) in Day 10 medulla (Doxo vs. Ctrl). DEGs (including Log2FC and p value) were calculated by the MAST method. The Benjamini–Hochberg method was used for multiple comparison adjustments. p value (adj. p) cutoff is < 0.05, and Log2FC cutoff is > 0.25. (f) Venn diagram showing the overlap of upregulated DEGs between Day 10 cortex and medulla (Doxo vs. ctrl). (g) Venn diagram showing the overlap of downregulated DEGs between Day 10 cortex and medulla (Doxo vs. ctrl). (h, i) Heatmaps depicting the top 20 absolute gene expression of up‐ and downregulated DEGs in cortex and medulla comparing Ctrl and Doxo‐treated expression. (j) Heatmaps depicting the Log2FC of the 27 shared upregulated DEGs, and the 9 downregulated DEGs in the cortex and medulla comparing Ctrl and Doxo‐treated expression.
FIGURE 4
FIGURE 4
Cell composition analysis by snRNA‐seq reveals cell types driving senescent signature in the ovary. (a) A UMAP plot of 10‐day single nuclei transcriptomes of explant ovarian tissue divided into cortex and medulla after doxorubicin (Doxo) treated and untreated (Ctrl). Cells were resolved into eight distinct cell types. (b) A stacked bar chart showing the quantification of the relative abundance of each cell type in cortex and medulla treated with (Doxo) and without doxorubicin (Ctrl) expressed by percent. (c, d) Heatmaps depicting senescence scores across different cell types within the ovarian cortex (c) and medulla (d) after 10‐day treatment with doxorubicin. These scores were calculated using 11 gene sets associated with cellular senescence. The heatmap values represent log2 fold changes of senescence scores in doxo‐treated cells relative to untreated controls. Nonsignificant differences are indicated with a dot. Statistical significance was assessed using a two‐sided t‐test, with a threshold of p < 0.05 for comparing doxo‐treated cells to controls within the same cell type. (e) Venn diagram showing the overlap of upregulated DEGs between Day 10 cortex and cortex stromal cells (Stroma 1) (f) Venn diagram showing the overlap of downregulated DEGs between Day 10 cortex and cortex stromal cells (Stroma 1). (g) Venn diagram showing the overlap of upregulated DEGs between Day 10 medulla and medulla stromal cells (Stroma 1). (h) Venn diagram showing the overlap of downregulated DEGs between Day 10 medulla and medulla stromal cells (Stromal 1). (i, j) Heatmaps depicting the top 20 Log2FC up‐ and downregulated shared DEGs between cortex and cortex stromal cells (i) and medulla stromal cells (j).
FIGURE 5
FIGURE 5
Spatial proteomic profiling of human ovarian explants identified SASP factors upon senescence induction. (a) Human ovarian cortex and medulla explants were cultured and treated with 0.1 μg/mL doxorubicin (doxo) to induce senescence or DMSO as control. After 10 days, tissues were thoroughly washed with serum‐free basal media and transferred to a clean plate with pre‐equilibrated serum‐free basal media and inserts. The conditioned media were collected after 24 h for proteomic analysis (Cortex: N = 6 for doxo and control, respectively, Medulla: N = 6 for doxo, N = 4 for control). Proteins were concentrated with centrifuge filters, digested using S‐trap, and proteolytic peptides were desalted. Peptides were analyzed on an Orbitrap Eclipse Tribrid mass spectrometer (Thermo Fisher Scientific) operated in data‐independent acquisition (DIA). DIA data were processed using directDIA (Biognosys) to identify SASP factors and enriched biological processes in the human ovarian (b–d) cortex and (e–g) medulla. (b, e) Supervised clustering using partial least squares‐discriminant analysis (PLS‐DA) performed with all 314 quantified protein groups (with ≥ 2 unique peptides) revealed treatment‐based grouping. (c, f) The volcano plots highlight the 164 significantly altered protein groups in the cortex and 217 ones in the medulla for the “Doxo versus Control” comparison (q value < 0.05 and absolute log2(foldchange) > 0.58). The blue dots represent the downregulated protein groups and the red dots the upregulated protein groups. The plot y‐axis is zoomed and five proteins on (c) and four proteins on (f) with q value < 3.30e‐24 are not displayed. (d, g) An over‐representation analysis was performed using ConsensusPathDB. The top5 Gene Ontology (GO) Biological Processes (BP) that are upregulated in “Doxo versus Control” are displayed (q value < 0.05 and term_level ≥ 4). (h) The Venn diagram shows the overlap between the cortex SASP and the medulla SASP, and five SASP factors are listed in the table (italic means nonsignificantly altered protein in the ovarian subregion).
FIGURE 6
FIGURE 6
Key candidates of doxorubicin‐induced cellular senescence and mapping on native postmenopausal ovarian tissue. (a) Venn diagrams showing the overlap of upregulated DEGs identified through transcriptomic and proteomic analysis in cortex (top) and in medulla (bottom). (b) ingenuity canonical pathway (IPA) analysis of 26 DEGs defines the signature of doxorubicin‐induced cellular senescence in the human postmenopausal ovary. (c) Mapping Lumican, SOD2, MYH9 and SASP factor Periostin on native ovarian tissue. Images on the left show colorimetric IHC scans (scale bar = 200 μm). Images on the right show digitally labeled images with yellow for positive staining and blue for negative staining. Values depict % of positive staining relative to tissue area. White and black outlined boxes represent the overlap Lumican, SOD2, MYH9, and Periostin in cortex and medulla, respectively. (d) A schematic overview of our study capturing the cellular senescence signature of doxorubicin‐induced human ovarian explant model and its potential implications.

Similar articles

Cited by

References

    1. Abbadie, C. , and Pluquet O.. 2020. “Unfolded Protein Response (UPR) Controls Major Senescence Hallmarks.” Trends in Biochemical Sciences 45, no. 5: 371–374. 10.1016/j.tibs.2020.02.005. - DOI - PubMed
    1. Adamus, J. , Aho S., Meldrum H., Bosko C., and Lee J. M.. 2014. “p16INK4A Influences the Aging Phenotype in the Living Skin Equivalent.” Journal of Investigative Dermatology 134, no. 4: 1131–1133. 10.1038/jid.2013.468. - DOI - PMC - PubMed
    1. Ahn, J. S. , Jang I. S., Kim D. I., et al. 2003. “Aging‐Associated Increase of Gelsolin for Apoptosis Resistance.” Biochemical and Biophysical Research Communications 312, no. 4: 1335–1341. - PubMed
    1. Ahn, J. S. , Jang I. S., Rhim J. H., Kim K., Yeo E. J., and Park S. C.. 2003. “Gelsolin for Senescence‐Associated Resistance to Apoptosis.” Annals of the New York Academy of Sciences 1010: 493–495. - PubMed
    1. Aibar, S. , González‐Blas C. B., Moerman T., et al. 2017. “SCENIC: Single‐Cell Regulatory Network Inference and Clustering.” Nature Methods 14, no. 11: 1083–1086. 10.1038/nmeth.4463. - DOI - PMC - PubMed

LinkOut - more resources