. 2025 May 30:8:0705.
doi: 10.34133/research.0705. eCollection 2025.

Lactate-Induced Mitochondrial Calcium Uptake 3 Aggravates Myocardial Ischemia-Reperfusion Injury by Promoting Neutrophil Extracellular Trap Formation

Affiliations

Lactate-Induced Mitochondrial Calcium Uptake 3 Aggravates Myocardial Ischemia-Reperfusion Injury by Promoting Neutrophil Extracellular Trap Formation

Hongru Zhang et al. Research (Wash D C). .

Abstract

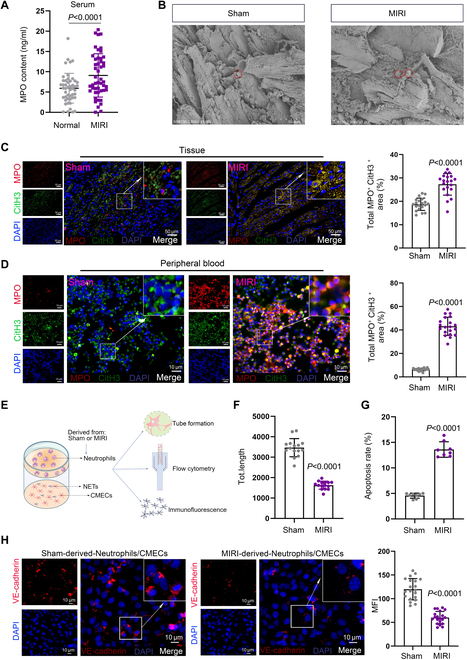
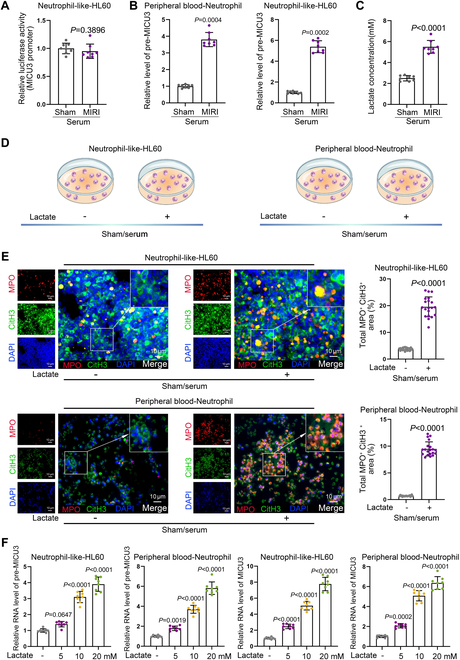
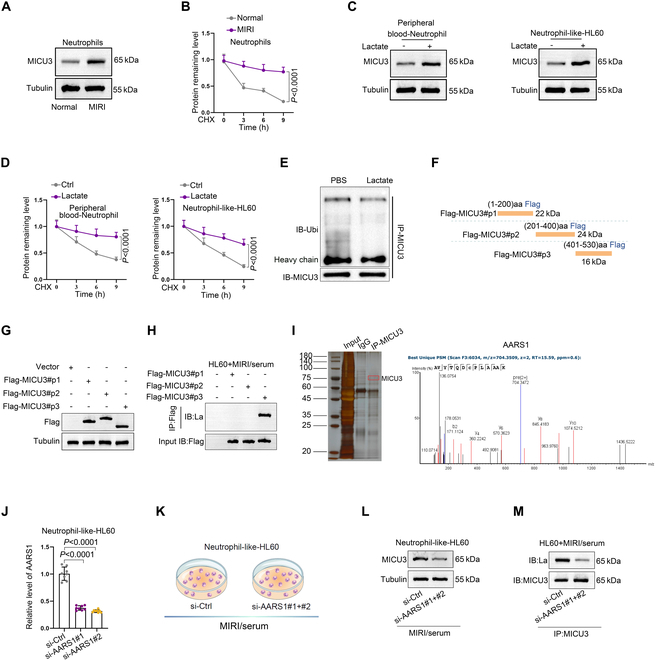
Background: Ischemic heart disease is a leading cause of mortality and disability worldwide among cardiovascular conditions. Myocardial ischemia-reperfusion injury (MIRI) occurs following percutaneous coronary intervention, during which neutrophils generate neutrophil extracellular traps (NETs) in response to injury. This study aims to elucidate the mechanisms underlying NET activation and its impact on MIRI. Methods: Sham and MIRI rat models were established. Various techniques, including enzyme-linked immunosorbent assay, hematoxylin and eosin staining, Masson staining, and transmission electron microscopy, were used to assess endothelial cell injury and myocardial tissue inflammation. Immunofluorescence was employed to evaluate NET activation in tissues, peripheral blood neutrophils, and protein colocalization. MitoTracker and ER-Tracker staining were conducted to assess the formation of mitochondria-associated membranes (MAMs). Extracted NETs were applied to conduct microvascular endothelial cell tube formation assay and flow cytometry. RNA-sequencing and immunoprecipitation-mass spectrometry were applied to determine the key regulators. Flow cytometry and Western blot were used to assess Ca2+ and mitophagy levels in neutrophils. Deoxyribonuclease I, NET inhibitor, was injected into MIRI rats to evaluate the in vivo effects of NET modulation on MIRI severity. Results: MIRI was often accompanied by cardiac microvascular endothelial cell (CMEC) injury and inflammation. Lactate mediated H3K18 lactylation at the MICU3 promoter in neutrophils, enhancing its transcription and leading to elevated MICU3 levels. Besides, lactate also promoted the interaction between MICU3 and AASR1, stabilizing MICU3 through lactylation. Up-regulated MICU3 interacted with VDAC1, facilitating MAM formation, excessive Ca2+ uptake, mitochondrial dysfunction, mitophagy activation, and NET activation. Elevated NET level exacerbated CMEC dysfunction, further aggravating MIRI. Conclusion: Lactate-driven MICU3 transcriptional activation and stabilization facilitates NET formation, contributing to MIRI development.


Conflict of interest statement

Author contributions: H.Z., Y.M. designed and conducted the research. S.X., L.L., and C.S. performed the experiments. X.J., J.L. analyzed the results. J.C. wrote the paper. Competing interests: The authors declare that they have no competing interests.

Figures

Fig. 1.
Fig. 1.
MIRI process is accompanied by CMEC injury and inflammatory infiltration. (A) The changes in cardiac function in different models (Sham and MIRI) were assessed using echocardiography. LVEF: Sham: 86.13 ± 17.84, MIRI: 48.88 ± 11.22; LVFS: Sham: 52.29 ± 10.80, MIRI: 22.00 ± 4.20 (n = 8 per group, mean ± SD). (B) The levels of CK-MB, LDH, and cTnI biomarkers in the serum from different groups were detected using ELISA. CK-MB: Sham: 12.47 ± 1.85 U/l, MIRI: 31.80 ± 3.44 U/l; LDH: Sham: 499.4 ± 35.30 U/l, MIRI: 31.80 ± 3.44 U/l; cTnI: Sham: 187.94 ± 16.96 pg/ml, MIRI: 756.84 ± 62.11 pg/ml (n = 8 per group, mean ± SD). (C) The extent of inflammatory infiltration was evaluated using H&E staining. Sham: 7.63% ± 0.89, MIRI: 16.99% ± 2.42 (n = 8 per group, mean ± SD). (D) Fibrosis in myocardial tissue was detected using Masson staining. Sham: 10.59% ± 2.02, MIRI: 36.71% ± 8.47 (n = 8 per group, mean ± SD). (E) The microvascular structure of myocardial tissue was observed using TEM (n = 3). Cap, vascular lumen; Enc, endothelial cells; N, nucleus; M, mitochondria; PV, pinocytotic vesicles; TJ, tight junctions.
Fig. 2.
Fig. 2.
Neutrophil-derived NETs of MIRI exacerbate endothelial cell injury. (A) The MPO concentration in the serum of MIRI patients and healthy individuals was measured using ELISA (n = 48). (B and C) SEM and IF were performed to analyze the levels of NETs in myocardial tissues from the Sham and MIRI groups. For SEM, n = 3 per group; for IF (n = 20 filed per group): Sham: 4.33% ± 0.74%, MIRI: 18.33% ± 3.75% (mean ± SD). (D) The levels of NETs from different groups were analyzed using IF. Sham: 21.22% ± 3.57%, MIRI: 74.94% ± 8.21% (n = 20 filed per group, mean ± SD). (E) CMECs were cocultured with neutrophil derived from either the Sham or MIRI groups. (F) Tube formation assay was conducted to analyze the angiogenic potential of CMECs under different treatment conditions. Sham: 3,467.40 ± 442.65, MIRI: 1,627.84 ± 197.24 (n = 15 per group, mean ± SD). (G) Apoptosis levels in CMECs from different treatment groups were detected using flow cytometry. Sham: 4.56% ± 0.49%, MIRI: 13.61% ± 1.51% (n = 8 per group, mean ± SD). (H) The expression of VE-cadherin of CMECs from different treatment groups was assessed using IF. Sham: 119.95 ± 22.50, MIRI: 60.00 ± 13.10 (n = 20 filed per group, mean ± SD).
Fig. 3.
Fig. 3.
MICU3-mediated mitochondrial homeostasis imbalance induces NET formation. (A) RNA-sequencing was employed to analyze differentially expressed genes in peripheral blood neutrophils derived from the Sham and MIRI groups (n = 3 per group). (B) A heatmap was generated to display the expression differences of mitochondrial-related genes (Ckmt1, Bdh1, AABR07030524.1, Ca5b, Acss3, Ascm1, Micu3, and Mrpl40) in the sequencing data (n = 3 per group). (C) A heatmap was applied to illustrate the RT-qPCR results of mitochondrial-related gene expression in neutrophils from the Sham and MIRI groups (n = 8 per group). (D and E) The expression levels of MICU3 protein in neutrophils collected from different rat models and clinical patients were detected using WB (n = 4 per group). (F) The level of MICU3 and NETs in neutrophils collected from different rat models and clinical patients was determined by IF (n = 3 per group). (G) The Ca2+ content in neutrophils from different groups was analyzed using flow cytometry. Sham: 13.67 ± 1.12, MIRI: 21.67 ± 2.59 (n = 8 per group, mean ± SD). (H) MICU3 was either knocked down or overexpressed in HL60 cells, with validation performed using RT-qPCR. Knockdown: si-Ctrl: 1.01 ± 0.11, si-MICU3#1: 0.25 ± 0.03, si-MICU3#2: 0.36 ± 0.04; overexpression: Vector: 1.01 ± 0.12, OE/MICU3: 4.80 ± 0.55 (n = 8 per group, mean ± SD). (I) Diagrams were created to illustrate the treatment of HL60 cells (with MICU3 knockdown or overexpression) using serum from Sham or MIRI rats. (J) Quantitative analysis of IF conducted to detect the level of NET activation in HL60 cells with different treatment. Sham/serum: Vector: 1.9 ± 0.00, OE/MICU3: 50.03 ± 6.74; MIRI/serum: si-Ctrl: 26.99 ± 3.61, si-MICU3#1+2: 11.99 ± 1.49 (n = 20 filed per group, mean ± SD). (K) The expression differences of mitophagy proteins DNM1L, PINK1, and PRKN in HL60 cells from different treatment groups were detected using WB (n = 3 per group).
Fig. 4.
Fig. 4.
MICU3 interacts with VDAC1 promoting the formation of MAMs to enhance mitophagy and NET activation. (A) A schematic diagram was created to illustrate the binding product process obtained from the IP-MS experiment. (B) MS analysis revealed the presence of VDAC1. (C) Co-IP was performed to confirm the binding of VDAC1 to MICU3 and to assess the different binding levels in neutrophils from various groups (n = 3 per group). (D) PLA assay was applied to determine the combination of VDAC1 and MICU3 (n = 3 per group). (E) IF was conducted to detect the colocalization ratio of MICU3 and VDAC1 between the Sham and MIRI groups. Sham: 0.53 ± 0.09, MIRI: 0.79 ± 0.12 (n = 20 filed per group, mean ± SD). (F) MitoTracker and ER-Tracker staining was performed to analyze the differences in the number of MAMs between the Sham and MIRI groups (n = 20 filed per group). (G) Schematic diagram depicting HL60 cells with knockdown of VDAC1 or MICU3 treated with serum of MIRI group. (H) MitoTracker and ER-Tracker staining was conducted to assess the level of MAMs in HL60 cells that were knocked down for MICU3/VDAC1 and treated with MIRI serum. MICU3 knockdown: 0.65 ± 0.045, VDAC1 knockdown: 0.44 ± 0.03, MIRI serum: 0.50 ± 0.05 (n = 20 filed per group, mean ± SD). (I) SEM was applied to observe the MAMs of Sham and MIRI (n = 10 filed per group).
Fig. 5.
Fig. 5.
Circulating lactate during MIRI promotes the up-regulation of MICU3 expression. (A) Luciferase reporter gene assay was conducted to investigate the effects of serum from different groups on the activity of the MICU3 promoter. Sham: 1.00 ± 0.09, MIRI: 0.88 ± 0.09 (n = 8 per group, mean ± SD). (B) RT-qPCR was performed to detect the impact of serum from different groups on the expression level of MICU3 pre-mRNA. Peripheral blood-Neutrophil: Sham: 1.00 ± 0.10, MIRI: 3.80 ± 0.42; Neutrophil-like-HL60: Sham: 1.00 ± 0.11, MIRI: 5.39 ± 0.57 (n = 8 per group, mean ± SD). (C) The lactate levels in serum samples from the MIRI group and the Sham group were measured. Sham: 169.65 ± 14.76, MIRI: 293.37 ± 20.12 (n = 20 filed per group, mean ± SD). (D) Schematic diagram depicting HL60 cells and peripheral blood neutrophil treated with or without lactate. (E) The effects of lactate on NET activation levels were assessed by IF assay (n = 20). (F) RT-qPCR was utilized to examine the impact of increasing concentrations of lactate on the levels of MICU3 pre-mRNA and mRNA. Neutrophil-like-HL60: pre-MICU3: Sham: 1.00 ± 0.11, MIRI: 1.40 ± 0.17; mRNA: Sham: 3.10 ± 0.35, MIRI: 3.90 ± 0.45; Peripheral blood-Neutrophil: pre-MICU3: Sham: 1.00 ± 0.10, MIRI: 1.80 ± 0.23; mRNA: Sham: 3.70 ± 0.40, MIRI: 5.82 ± 0.63; Neutrophil-like-HL60: MICU3: Sham: 1.00 ± 0.12, MIRI: 2.48 ± 0.28; mRNA: Sham: 5.07 ± 0.54, MIRI: 7.77 ± 0.83; Peripheral blood-Neutrophil: MICU3: Sham: 1.00 ± 0.11, MIRI: 2.08 ± 0.22; mRNA: Sham: 5.08 ± 0.52, MIRI: 6.35 ± 0.64 (n = 8 per group, mean ± SD).
Fig. 6.
Fig. 6.
Lactate up-regulates MICU3 expression by mediating H3K18la. (A) The TSS of the MICU3 gene, along with upstream and downstream promoter and enhancer signal sites, was obtained from the UCSC website. (B) A schematic diagram was created for primer design. (C) ATAC-qPCR was performed to assess chromatin accessibility at potential regulatory sites within the MICU3 gene promoter region before and after lactate treatment. (D) WB was used to detect changes in the total levels of total lactylation modifications in neutrophils from the Sham and MIRI groups (n = 3 per group). (E) WB was conducted to analyze the changes in lactylation modification levels at various histone sites in neutrophils and HL60 cells from different groups (n = 3 per group). (F) ChIP was performed to verify the increased H3K18 lactylation modification at the promoter and enhancer of the MICU3 gene in the Sham and MIRI groups. Neutrophil-like-HL60: E2612829/enhP: Sham: 1.00 ± 0.10, MIRI: 5.40 ± 0.60; E2612830/prom: Sham: 1.01 ± 0.11, MIRI: 6.80 ± 0.74; E2612831/prom: Sham: 1.01 ± 0.12, MIRI: 7.40 ± 0.80; E2612832/enhP: Sham: 1.00 ± 0.09, MIRI: 6.19 ± 0.66. Neutrophil: E2612829/enhP: Sham: 1.00 ± 0.11, MIRI: 6.79 ± 0.71; E2612830/prom: Sham: 1.01 ± 0.13, MIRI: 8.60 ± 0.92; E2612831/prom: Sham: 1.00 ± 0.10, MIRI: 7.20 ± 0.75; E2612832/enhP: Sham: 1.01 ± 0.11, MIRI: 5.48 ± 0.65 (n = 8 per group, mean ± SD).
Fig. 7.
Fig. 7.
Lactate/AARS1 enhances the stability of MICU3 protein through lactylation modification, promoting NET activation. (A) WB assay was performed to detect the level of MICU3 in clinical samples (n = 3). (B) Neutrophils were treated with CHX, and WB assay was performed to determine the level of MICU3 (n = 3). (C) Under the influence of lactate, WB was used to detect the expression of MICU3 protein in HL60 cells and neutrophils derived from peripheral blood (n = 3). (D) Under the influence of lactate, the CHX chase assay was conducted to assess the stability of MICU3 protein (n = 3). (E) WB was used to determine the ubiquitination modification level of MICU3 under lactate treatment (n = 3). (F) Fusion proteins with Flag tags were constructed for different MICU3 protein segments: P1 (1–200), P2 (201–400), and P3 (401–530). (G) After transfecting HL60 cells with the fusion expression proteins, WB was utilized to verify the expression efficiency (n = 3). (H) Co-IP was conducted to detect differences in lactylation modification levels among the 3 segments (n = 3). (I) Analysis of silver staining and MS results of binding proteins of MICU3 obtained from IP experiments (n = 3). (J) RT-qPCR was used to validate the knockdown efficiency of AARS1 in HL60 cells. si-Ctrl: 1.01 ± 0.12, si-AARS1#1: 0.37 ± 0.04, si-AARS1#2: 0.32 ± 0.03 (n = 8 per group, mean ± SD). (K to M) Changes in the lactylation modification levels of MICU3 and the expression of MICU3 protein were assessed after knockdown of AARS1 (n = 3).
Fig. 8.
Fig. 8.
Animal-level validation shows that NET generation exacerbates microvascular endothelial cell injury and worsens MIRI. (A) H&E staining was used to assess inflammatory infiltration in tissue samples from different groups. Sham: 10.00 ± 1.51, MIRI: 22.00 ± 4.81, MIRI + DNase I: 15.75 ± 2.82, MIRI + GSK484: 16.97 ± 3.06 (n = 8 per group, mean ± SD). (B) Masson staining was conducted to detect fibrosis in tissue samples from different groups. Sham: 3.29% ± 0.64%, MIRI: 30.28% ± 5.87%, MIRI + DNase I: 15.91% ± 2.92%, MIRI + GSK484: 17.12% ± 2.48% (n = 8 per group, mean ± SD). (C) TEM was used to observe changes in the microvascular structure of myocardial tissue. Cap, vascular lumen; Enc, endothelial cells; N, nucleus; M, mitochondria; PV, pinocytotic vesicles; TJ, tight junctions (n = 3). (D) IF was performed to detect the expression of VE-cadherin of HUVECs under different treatments. Neutrophils/Sham: 136.08 ± 20.98, Neutrophils/MIRI: 69.45 ± 8.91, Neutrophils/MIRI + DNase I: 108.14 ± 12.38, Neutrophils/MIRI + GSK484: 111.44 ± 16.16 (n = 20 filed per group, mean ± SD).

References

    1. Guan C, Wu S, Xu W, Zhang J. Global, regional, and national burden of ischaemic heart disease and its trends, 1990-2019. Public Health. 2023;223:57–66. - PubMed
    1. Crea F, Montone RA, Rinaldi R. Pathophysiology of coronary microvascular dysfunction. Circ J. 2022;86(9):1319–1328. - PubMed
    1. Marzilli M, Merz CNB, Boden WE, Bonow RO, Capozza PG, Chilian WM, DeMaria AN, Guarini G, Huqi A, Morrone D, et al. . Obstructive coronary atherosclerosis and ischemic heart disease: An elusive link! J Am Coll Cardiol. 2012;60(11):951–956. - PubMed
    1. Nowbar AN, Gitto M, Howard JP, Francis DP, al-Lamee R. Mortality from ischemic heart disease. Circ Cardiovasc Qual Outcomes. 2019;12(6): Article e005375. - PMC - PubMed
    1. Davari M, Sorato MM, Fatemi B, Rezaei S, Sanei H. Medical therapy versus percutaneous coronary intervention or coronary artery bypass graft in stable coronary artery disease; a systematic review and meta-analysis of randomized clinical trials. ARYA Atheroscler. 2022;18(3):1–12. - PMC - PubMed

LinkOut - more resources