. 2024 Jun 10;1(3):100025.
doi: 10.1016/j.bneo.2024.100025. eCollection 2024 Sep.

Functional multiomics reveals genetic and pharmacologic regulation of surface CD38 in multiple myeloma

Affiliations

Functional multiomics reveals genetic and pharmacologic regulation of surface CD38 in multiple myeloma

Priya Choudhry et al. Blood Neoplasia. .

Abstract

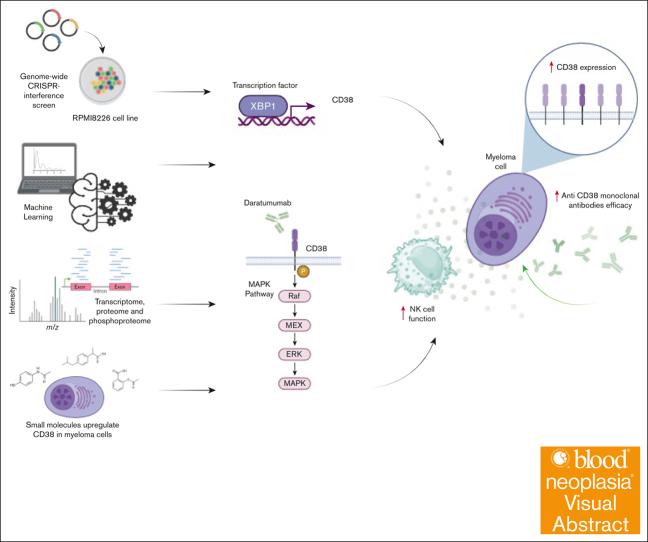
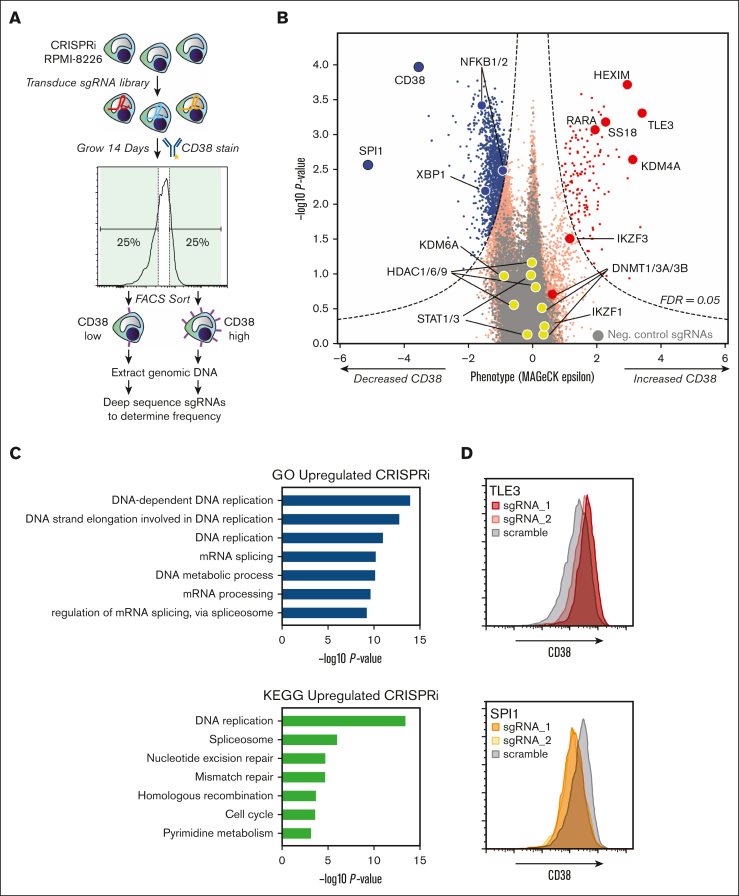
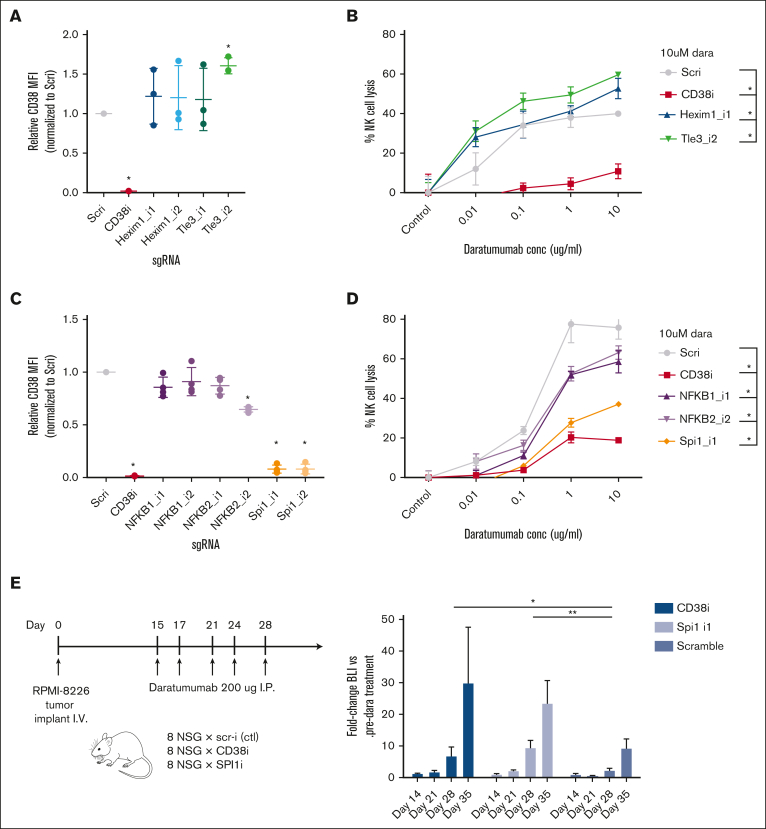
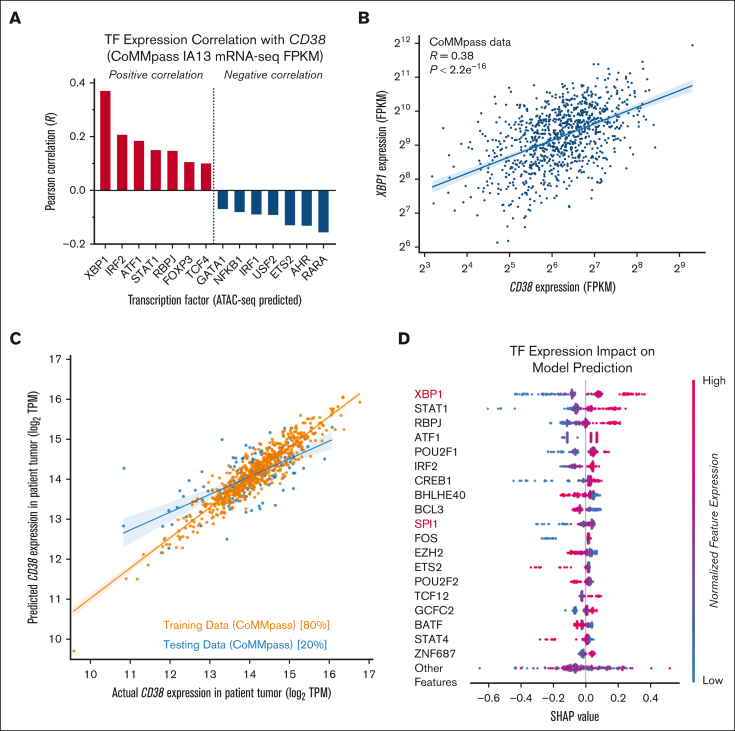
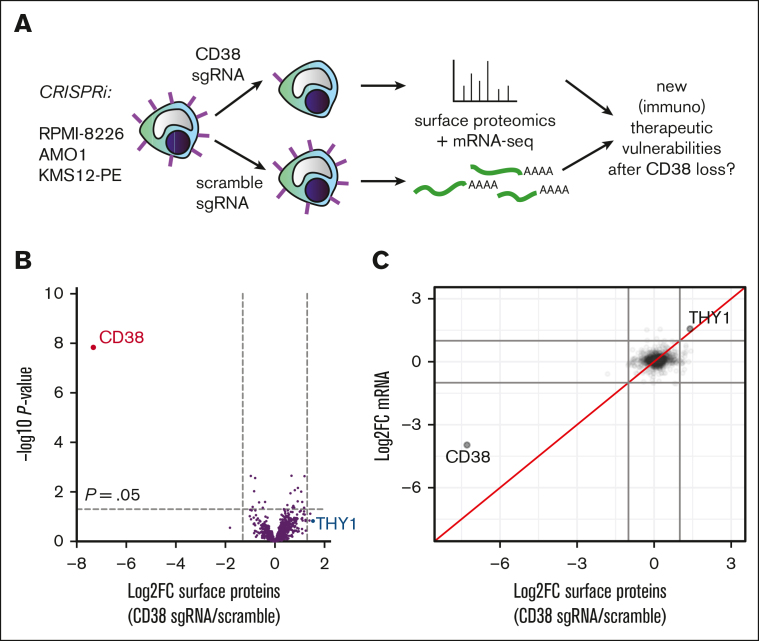
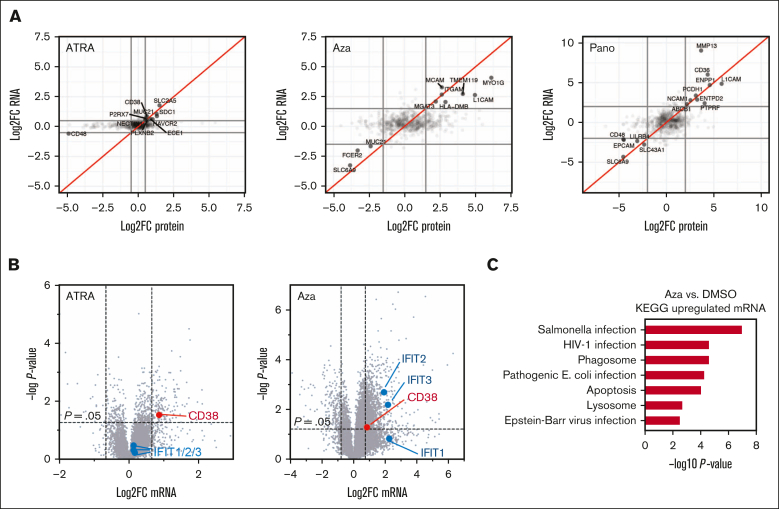
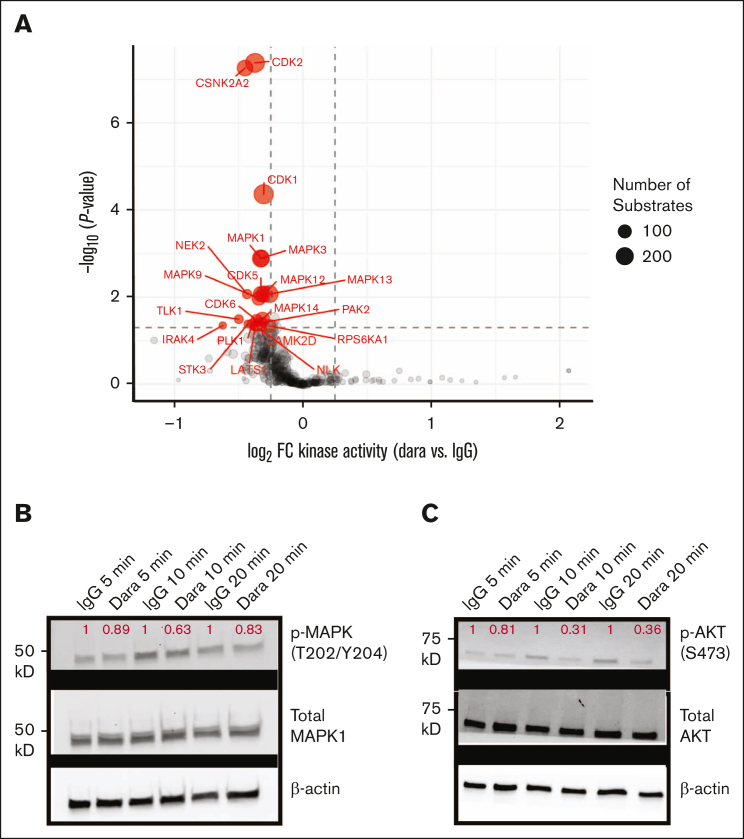
CD38 is a surface ectoenzyme expressed at high levels on myeloma plasma cells and is the target for the monoclonal antibodies (mAbs) daratumumab and isatuximab. Pretreatment CD38 density on tumor cells is an important determinant of mAb efficacy. Several small molecules have been found to increase tumor surface CD38, with the goal of boosting mAb efficacy in a cotreatment strategy. Numerous other CD38-targeting therapeutics are currently in preclinical or clinical development. Here, we sought to extend our currently limited insight into CD38 surface expression by using a multiomics approach. Genome-wide CRISPR interference screens integrated with patient-centered epigenetic analysis confirmed known regulators of CD38, such as RARA, while revealing XBP1 and SPI1 as other key transcription factors governing surface CD38 levels. CD38 knockdown followed by cell surface proteomics demonstrated no significant remodeling of the myeloma "surfaceome" after genetically induced loss of this antigen. Integrated transcriptome and surface proteome data confirmed high specificity of all-trans retinoic acid in upregulating CD38, in contrast to the broader effects of azacytidine and panobinostat. Finally, unbiased phosphoproteomics identified inhibition of MAP kinase pathway signaling in tumor cells after daratumumab treatment. Our work provides a resource to design strategies to enhance efficacy of CD38-targeting immunotherapies in myeloma.


Conflict of interest statement

Conflict-of-interest disclosure: P.C. is a shareholder of Genentech/Roche. P.R. is a shareholder of Senti Biosciences. A.P.W. is an equity holder and scientific advisory board member of Indapta Therapeutics, LLC and Protocol Intelligence, LLC. M.K. has filed a patent application related to CRISPRi screening (US patent number PCT/US15/40449); and serves on the scientific advisory boards of Engine Biosciences, Cajal Neuroscience, and Casma Therapeutics. The remaining authors declare no competing financial interests. The current affiliation for P.C. is Genentech/Roche, South San Francisco, CA. The current affiliation for P.R. is Senti Biosciences, South San Francisco, CA.

Figures

None
Graphical abstract
Figure 1.
Figure 1.
CRISPRi screening reveals genetic determinants of surface CD38 regulation. (A) Schematic of CRISPRi screen design. (B) Results of CRISPRi screen demonstrating genes that, when knocked down, regulate surface CD38 in RPMI-8226 cells. The x-axis indicates phenotype (epsilon) from MAGeCK statistical analysis. Dashed line indicates cutoff for significant change at false discovery rate (FDR) <0.05. Genes of interest are specifically labeled. 4000 negative control nontargeting sgRNAs are in gray. (C) Gene ontology (GO) Biological Process and KEGG analysis of all genes that when knocked down lead to significant CD38 upregulation. (D) Follow-up flow cytometry validation of CRISPRi screen hits using 2 individual sgRNAs per gene demonstrates TLE3 knockdown drives increased CD38, whereas SPI1 knockdown leads to CD38 decrease.
Figure 2.
Figure 2.
Validation of CRISPRi screen hits as functionally affecting daratumumab efficacy. (A) Knockdown of HEXIM1 and TLE3 with 2 independent sgRNAs per gene (AMO1 myeloma cells, n = 3) followed by flow cytometry shows significant surface CD38 increase with TLE3_i2 sgRNA and trend toward increased CD38 with HEXIM1_i1 sgRNA. (B) Results from ADCC assays with AMO1 cells stably expressing the noted sgRNAs and incubated with the indicated concentration of daratumumab or isotype control antibody (1:20 myeloma:NK ratio; 20 hours; n = 2). The percent lysis by ADCC was calculated using the following formula: % lysis = (signal in presence of daratumumab – signal in presence of IgG1 control antibody) ×100/signal in presence of IgG1 control antibody. At 10 μM daratumumab, both HEXIM1 and TLE3 knockdown led to significant increase in ADCC. (C) Similar to panel A, sgRNA knockdown of NFKB1, NFKB2, and SPI1 with fold-change in CD38 by flow cytometry (RPMI-8226 cells, n = 3). (D) Similar to panel B, knockdown with the most effective sgRNA for each gene show significant decreases in NK-cell ADCC at 10 μM daratumumab in the RMPI-8266 cells (n = 3). (E) In vivo validation of SPI1 knockdown driving daratumumab resistance. NOD scid gamma mice were IV implanted with CRISPRi RPMI-8226 cells stably expressing both luciferase and noted sgRNA, then treated with 200 μg daratumumab on the noted schedule. Bioluminescence imaging measurement of tumor burden demonstrates significantly increased fold-change in tumor burden (normalized to predaratumumab intensity) with either CD38 or SPI1 knockdown compared with scramble sgRNA. (A-E) ∗P < .05; ∗∗P < .01, by 2-tailed t test. conc, concentration; I.P., intraperitoneal; MFI, mean fluorescence intensity; NSG, NOD scid gamma; Scri, nontargeting control sgRNA.
Figure 3.
Figure 3.
Patient–centered epigenetic analysis and machine learning predicts the most potent transcriptional regulators of CD38. (A) A total of 46 transcription factors predicted to bind to the CD38 locus were derived from motif analysis of published ATAC-seq data (see supplemental Figure 3). Gene expression of each transcription factor (TF) was correlated with CD38 expression in the Multiple Myeloma Research Foundation (MMRF) CoMMpass database (release IA13), with RNA-seq data from CD138+ enriched tumor cells at diagnosis (n = 664 patients). Top predicted positive and negative regulators are shown based on Pearson correlation (R). (B) CoMMpass RNA-seq data illustrate strong positive correlation between XBP1 and CD38 expression. (C) XGBoost machine learning model was used to extract features of TF gene expression that best-model CD38 expression in CoMMpass tumors (shown in log2 TPM [transcripts per million]); 80% of data were used as test set, with 20% left out as a training set. Coefficient of variation (R2) for predictive model = 0.49 after five-fold cross-validation. (D) Shapley additive explanations (SHAP) analysis indicates transcription factors whose expression most strongly affects CD38 expression levels in CoMMpass tumors. FPKM, fragments per kilobase million; TPM, transcripts per million.
Figure 4.
Figure 4.
Minimal alterations of the myeloma cell surface proteome after CD38 loss. (A) Schematic of “antigen escape profiling” approach to reveal new cell surface therapeutic vulnerabilities in the context of CD38 downregulation. (B) Cell surface capture proteomics comparing CD38 knockdown vs nontargeting sgRNA control, with aggregated data across 3 cell lines (CRISPRi-expressing RPMI-8226, AMO1, and KMS12-PE; n = 3 replicates per cell line per sgRNA) reveals minimal changes in the cell surface proteome beyond CD38 knockdown at significance cutoff of P value <.05 and log2 fold-change >|1.5|. (C) Integrated analysis of cell surface proteomics and mRNA-seq (n = 2 per cell line per guide) across 3 cell lines reveals the only consistent change at both protein and transcript level after CD38 knockdown is THY1/CD90 upregulation. Log2 fold-change cutoff = |1.5|.
Figure 5.
Figure 5.
ATRA drives CD38 upregulation with limited additional cellular impact, whereas Aza leads to a broad interferon-mediated response. (A) Integrated mRNA-seq (n = 2 per drug treatment) and cell surface proteomics (n = 2 per drug treatment) across RPMI-8226 treatment with 10 nM ATRA, 2 μM Aza, and 10 nM panobinostat (Pano). All plots are in comparison with control replicates treated with 0.1% DMSO. Doses chosen are based on those previously published to lead to CD38 upregulation for each agent. Data points shown are for proteins and genes corresponding to Uniprot-annotated membrane-spanning proteins. Log2 fold-change cutoffs shown at |0.5| for ATRA and |2.0| for Aza and Pano to increase clarity of plots given many fewer changed genes with ATRA treatment. (B) RNA-seq for same samples with ATRA or Aza treatment vs DMSO but here showing all mapped genes, not just those annotated as membrane-spanning. Significance cutoff at P value <.05 with log2 fold-change cutoff set at |0.8| to illustrate prominent differences above this level in transcriptome alteration after either ATRA or Aza treatment. (C) KEGG analysis of genes from RNA-seq data set meeting cutoff criteria of P value <.05 and log2 fold-change >0.8 after Aza treatment. DMSO, dimethyl sulfoxide.
Figure 6.
Figure 6.
Unbiased phosphoproteomics reveals downregulation of proliferative signaling after daratumumab treatment. (A) RPMI-8226 cells were treated with 20 μM daratumumab (Dara) or IgG1 isotype control for 20 minutes (n = 3 each) and then harvested for unbiased phosphoproteomics with immobilized metal affinity chromatography enrichment for phosphopeptide enrichment. Plot displays results of kinase substrate enrichment analysis, indicating modest decrease in phosphorylation of numerous predicted substrates of MAPK pathway kinases as well as cyclin-dependent kinases (cutoff, P < .05; log2 fold-change > |0.5|). (B) Western blot in RPMI-8226 of MAPK (ERK1/2) (Thr202/Tyr204) relative to total MAPK demonstrates modest decrease in MAPK phosphorylation after 5, 10, or 15 minutes of Dara treatment; magnitude of change normalized to IgG1 control at each time point (red) appears consistent with phosphoproteomic data. (C) Western blot of MM.1S cells treated with Dara and blotted for p-AKT (Ser473) and total AKT, with quantification of p-AKT relative to total AKT and normalized to IgG1 at each time point. All images representative of 2 independent western blots.

Similar articles

References

    1. Syed YY. Daratumumab: a review in combination therapy for transplant-ineligible newly diagnosed multiple myeloma. Drugs. 2019;79(4):447–454. - PubMed
    1. Bonello F, D'Agostino M, Moscvin M, Cerrato C, Boccadoro M, Gay F. CD38 as an immunotherapeutic target in multiple myeloma. Expert opinion on biological therapy. 2018;18(12):1209–1221. - PubMed
    1. van de Donk N, Usmani SZ. CD38 antibodies in multiple myeloma: mechanisms of action and modes of resistance. Front Immunol. 2018;9:2134. - PMC - PubMed
    1. Saltarella I, Desantis V, Melaccio A, Solimando AG, Lamanuzzi A, Ria R, et al. Mechanisms of Resistance to Anti-CD38 Daratumumab in Multiple Myeloma. Cells. 2020;9(1) - PMC - PubMed
    1. Nijhof IS, Casneuf T, van Velzen J, van Kessel B, Axel AE, Syed K, et al. CD38 expression and complement inhibitors affect response and resistance to daratumumab therapy in myeloma. Blood. 2016;128(7):959–970. - PubMed