Randomized Controlled Trial
. 2025 May 16:16:1583460.
doi: 10.3389/fimmu.2025.1583460. eCollection 2025.

Extracorporeal photopheresis as induction therapy in lung transplantation for cystic fibrosis: a pilot randomized trial

Affiliations
Randomized Controlled Trial

Extracorporeal photopheresis as induction therapy in lung transplantation for cystic fibrosis: a pilot randomized trial

Ilaria Righi et al. Front Immunol. .

Abstract

Introduction: Extracorporeal photopheresis (ECP) is a viable treatment that slows the progression of chronic lung allograft dysfunction. Despite its immunoregulatory potential, data on extracorporeal photopheresis as an induction therapy remain rather limited.

Methods: We conducted a pilot randomized controlled study on ECP as induction therapy in cystic fibrosis patients undergoing primary lung transplantation. Primary endpoints included safety, assessed based on the incidence of adverse events, treatment-related toxicity, and procedure-related complication rates; and feasibility, evaluated through the completion rate of scheduled ECP sessions, patient tolerability, and treatment discontinuation rates. Secondary endpoint consisted of an exploratory assessment of efficacy, using a composite measure that included three key components: freedom from biopsy-proven acute rejection within the first 12 months, absence of chronic lung allograft dysfunction at 36 months, and optimal graft function, defined as a predicted forced expiratory volume in the first second ≥ 90% at 36 months. Finally, exploratory endpoints included cell phenotypic and functional analyses, secreted immune protein profiling, and gene expression analysis for mechanistic insights. Patients were randomly assigned to receive either standard immunosuppressive therapy alone or standard therapy plus six sessions of extracorporeal photopheresis, with a follow-up period of 36 months.

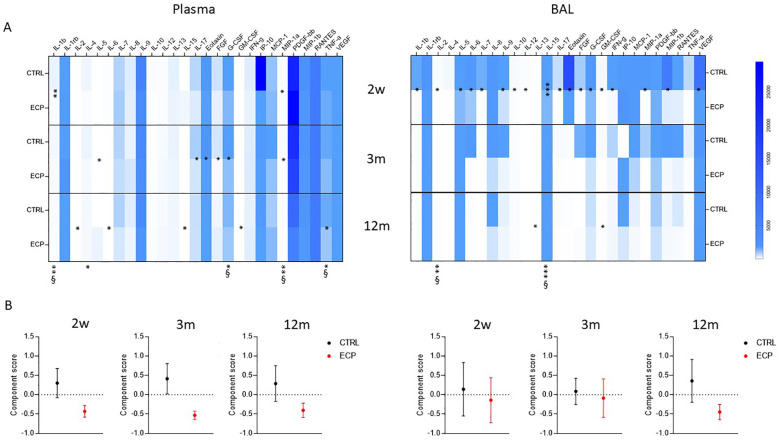
Results: Among 36 cystic fibrosis patients who underwent lung transplantation between 2018 and 2021 and met the eligibility criteria, 21 were randomized (9 to the study group and 12 to the control group). No patients in the treatment group experienced adverse events. The enrollment rate was 61%, and the treatment discontinuation rate was 22%. The clinical composite endpoint was achieved by 28.6% of patients in the treatment group and 16.7% in the control group. Exploratory endpoint analyses revealed significant decreases in pro-inflammatory cytokines, degranulating CD8+ T lymphocytes, and NK cells in the treatment group. Moreover, significant increases in Treg lymphocytes, IL-10-producing NK cells, and anti-inflammatory cytokines appeared to be associated with improved pulmonary function in the treatment group.

Conclusions: Induction therapy with extracorporeal photopheresis is safe and feasible in lung transplantation for cystic fibrosis. Some clinical benefits appear to persist for the first 36 months of follow-up. Interestingly, a correlation between immunological modulation induced by extracorporeal photopheresis and pulmonary function was observed.

Clinical trial registration: https://clinicaltrials.gov/study/NCT03500575?cond=NCT03500575&rank=1, identifier NCT03500575.

Keywords: cystic fibrosis; immunomodulation; induction therapy; lung transplanation; photopheresis.


Conflict of interest statement

The authors of this manuscript have no conflicts of interest to disclose as described by the American Journal of Transplantation. The author(s) declared that they were an editorial board member of Frontiers, at the time of submission. This had no impact on the peer review process and the final decision.

Figures

Figure 1
Figure 1
Graphical representation of the treatment protocol and patient surveillance. Analyses included routine laboratory tests, lung function assessment via spirometry at least three weeks post-transplantation, and documentation of adverse events. Surveillance bronchoscopy for infection screening was performed at weeks 1, 2, and 3, while transbronchial biopsies for rejection monitoring were conducted at weeks 12, 24, and 54. For study purposes, clinical follow-up continued for up to 36 months. ECP, extracorporeal photopheresis group; CTRL, control group; LuTx, lung transplantation.
Figure 2
Figure 2
CONSORT flow diagram displaying the patient inclusion process.
Figure 3
Figure 3
Diagram of the best FEV1 dynamics over 24 months. Time factor linear model p<0.001, size effect η2p=0.258. Group factor linear model p=0.035, size effect η2p=0.595. ECP, extracorporeal photopheresis group; CTRL, control group; FEV1, percent predicted forced expiratory volume in 1 second.
Figure 4
Figure 4
Cell phenotypic and functional analyses were assessed in control group (CTRL, in black) and ECP group (ECP, in red). (A) Double positive PD1+/PD1L+ expressing CD4+ T lymphocytes were evaluated. Time factor (dashed line) linear model p=0.032, size effect η2p=0.202. Pairwise comparison at month 3 was p=0.008. (B) T regulatory lymphocytes. IL10 expressing T regulatory lymphocytes (Treg: CD3+CD4+CD25+FoxP3+). Pairwise comparison at month 12 was p=0.05. (C) T helper 17 lymphocytes. Left panel: IL17 expressing T helper 17 lymphocytes (Th17:CD3+CD4+RORγt+). Time factor (dashed line) linear model p=0.014, size effect η2p=0.253. right panel: IL21 expressing Th17. Time factor (dashed line) linear model p=0.012, size effect η2p=0.262. (D) T helper 1 lymphocytes. IFNγ expressing T helper 1 lymphocytes (Th1: CD3+CD4+Tbet+). Time factor (dashed line) linear model p<0.001, size effect η2p=0.312. (E) Cytotoxic T cell. Upper left panel: cytotoxic T cell (CTL: CD3+CD8+). Group factor linear model p=0.025. Pairwise comparison at weeks 2 and 3 were p=0.002 and p=0.040, respectively. Upper right panel: Degranulating (CD107+). Group factor linear model p=0.057. Pairwise comparison at month 2 was p=0.038. Lower left panel: Perforin expressing (Perf+) CTL. Lower right panel: Granzyme expressing (Granz+) CTL. Pairwise comparison at month 12 was p=0.046. (F) Natural Killer. Upper left panel: IL10 expressing (IL10+) Natural Killer (NK: CD3-CD15+CD56+). Group factor linear model p<0.001, size effect η2p=0.163. Pairwise comparison at week 3, week 4, month 2 was p=0.030, p=0.003 and p=0.043, respectively. Upper right panel: Perforin expressing (Perf+) NK. Group factor linear model p=0.047, size effect η2p=0.061. Pairwise comparison at week 3 was p=0.015. Lower panel: Granzyme expressing (Granz+) NK. Group factor linear model p=0.012, size effect η2p=0.039. ***p<0.001, **p<0.01, *p<0.05.
Figure 5
Figure 5
Secreted soluble factors. (A) Secretome analysis. Secreted soluble factors were evaluated (upper panels) in plasma (left) and BAL (right) control group (CTRL) and ECP group (ECP) at week 2, month 3 and 12. Values are expressed in pg/ml. Group factor linear model statistical significance scores are displayed below the heatmap, while the pairwise comparison on the corresponding slots (***p<0.001, **p<0.01, *p<0.05. § large effect size). (B) Component analysis (lower panel) scores performed on plasma (left) and BAL (right) soluble factors are displayed for control group (CTRL, in black) and ECP group (ECP, in red) at month 3 and 12. (Student’s t test p=0.057, size effect Cohen’s d=1.04).
Figure 6
Figure 6
Gene expression analysis. mRNA expression of 84 genes was performed on PBMCs (left panel) and BAL (right panel) in control group (CTRL) and ECP group (ECP) at week 2, month 3 and 12. Values are expressed in fold induction over five housekeeping genes. Group factor linear model statistical significance scores are displayed below the heatmap, while the pairwise comparison on the corresponding slots (***p<0.001, **p<0.01, *p<0.05. § large effect size).
Figure 7
Figure 7
Correlation analysis: (A) FEV1/flow cytometric analysis correlation was performed at month 3 and 12 in CTRL and ECP groups. The color coding is relative to the effect size (where the dark blue/violet means large effect - Pearson’s r> ± 0.5, light blue/violet means intermediate effect - ± 0.5>Pearson’s r> ± 0,3, while white 0,3>r>-0,3). Moreover. blue is assigned to positive correlation (+), while violet to negative correlation (-). (B) FEV1/soluble factors analysis correlation was performed at month 3 and 12 in CTRL and ECP groups in plasma (left panel) and BAL (right panel). *p<0.05, **p<0.01.

References

    1. Miggins JJ, Reul RM, Jr., Barrett S, Rana A, Alnajar A, Dunson J, et al. . Twenty-year survival following lung transplantation. J Thorac Dis. (2023) 15:2997–3012. doi: 10.21037/jtd-22-1414 - DOI - PMC - PubMed
    1. Gunasekaran M, Bansal S, Ravichandran R, Sharma M, Perincheri S, Rodriguez F, et al. . Respiratory viral infection in lung transplantation induces exosomes that trigger chronic rejection. J Heart Lung Transplantation. (2020) 39:379–88. doi: 10.1016/j.healun.2019.12.009 - DOI - PMC - PubMed
    1. Christie JD, Edwards LB, Kucheryavaya AY, Benden C, Dipchand AI, Dobbels F, et al. . The registry of the international society for heart and lung transplantation: 29th adult lung and heart-lung transplant report—2012. J Heart Lung Transplantation. (2012) 31:1073–86. doi: 10.1016/j.healun.2012.08.004 - DOI - PubMed
    1. Treede H, Glanville AR, Klepetko W, Aboyoun C, Vettorazzi E, Lama R, et al. . Tacrolimus and cyclosporine have differential effects on the risk of development of bronchiolitis obliterans syndrome: Results of a prospective, randomized international trial in lung transplantation. J Heart Lung Transplantation. (2012) 31:797–804. doi: 10.1016/j.healun.2012.03.008 - DOI - PubMed
    1. Burton CM, Iversen M, Carlsen J, Mortensen J, Andersen CB, Steinbrüchel D, et al. . Acute cellular rejection is a risk factor for bronchiolitis obliterans syndrome independent of post-transplant baseline FEV1. J Heart Lung Transplantation. (2009) 28:888–93. doi: 10.1016/j.healun.2009.04.022 - DOI - PubMed

Publication types

Associated data