. 2025 Jan 20;2(2):100069.
doi: 10.1016/j.bneo.2025.100069. eCollection 2025 May.

A feedforward loop between ACLY and MYC supports T-ALL progression in vivo

Affiliations

A feedforward loop between ACLY and MYC supports T-ALL progression in vivo

Victoria da Silva-Diz et al. Blood Neoplasia. .

Abstract

T-cell acute lymphoblastic leukemia (T-ALL) is a hematological malignancy in need of novel therapeutic approaches. Here, we identify ATP-citrate lyase (ACLY) as overexpressed in human T-ALL and as a promising therapeutic target for its treatment. To test the effects of ACLY in leukemia progression, we developed an isogenic model of NOTCH1-induced Acly conditional knockout leukemia. Importantly, we observed intrinsic antileukemic effects upon loss of ACLY, which further synergized with NOTCH1 inhibition in vivo. Metabolomic profiling upon ACLY loss revealed a metabolic crisis with reduced acetyl-coenzyme A (acetyl-CoA) levels and decreased oxygen consumption rate. Gene expression profiling analyses showed that the transcriptional signature of ACLY loss very significantly correlates with the signature of MYC loss in vivo. Mechanistically, the decrease in acetyl-CoA led to reduced H3K27ac levels in Myc, resulting in transcriptional downregulation of Myc and drastically reduced MYC protein levels. Moreover, pharmacological inhibition of ACLY led to reduced MYC levels and antileukemic effects in human T-ALL cell lines and patient-derived xenografts. Interestingly, our analyses also revealed a reciprocal relationship whereby ACLY itself is a direct transcriptional target of MYC, thus establishing a feedforward loop that is important for leukemia progression. Overall, our results identified a relevant ACLY-MYC axis and unveiled ACLY as a novel promising target for T-ALL treatment.


Conflict of interest statement

Conflict-of-interest disclosure: The authors declare no competing financial interests.

Figures

None
Graphical abstract
Figure 1.
Figure 1.
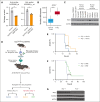
ACLY is a novel therapeutic target in T-ALL. (A) mRNA levels of Acly upon NOTCH1 inhibition with the DBZ gamma-secretase inhibitor in mouse T-ALL in vivo (∗∗P < .01 calculated with 2-tailed Student t test). (B) Box plot showing ACLY expression among T-ALL samples (n = 57) and physiological thymocyte subsets (n = 21). Quantile normalization was performed across samples. Boxes represent first and third quartiles, and lines represent the median. Whiskers represent the upper and lower limits (P < .001 using Mann-Whitney U test; FDR <.05 using Benjamini-Hochberg correction). (C) Western blot analysis of ACLY and ACTIN expression in human PBMNCs, CD4+ T cells, or healthy human thymocytes, as compared with human T-ALL. (D) Schematic illustration of retroviral-transduction protocol for the generation of NOTCH1-induced T-ALLs from inducible Acly conditional knockout mice, followed by transplant into secondary recipients treated with vehicle (Acly+) or tamoxifen (Acly−), with or without DBZ. (E) Kaplan-Meier survival curves of mice harboring Acly-positive and Acly-deleted isogenic leukemias (n = 10 per group). (F) Kaplan-Meier survival curves of mice harboring Acly-positive and Acly-deleted isogenic leukemias treated with 4 cycles of DBZ (5 mg/kg) on a 4-day-on (blue blocks at the bottom) and 3-day-off schedule (n = 10 per group). (G) Western blot analysis of ACLY, ACSS2, and ACTIN expression in leukemic spleens from terminally ill mice from the survival curve in panel E. ∗∗∗P < .005 in panels B-C calculated with log-rank test; ∗P < .05; ∗∗P < .01; ∗∗∗P < .005 in panels D-F calculated with log-rank test calculated with 2-tailed Student t test. d, day; PBMNC, peripheral blood mononuclear cell.
Figure 2.
Figure 2.
ACLY loss is dispensable for normal T-cell development in vivo. (A) Thymus weight in Aclyflox/flox-Vav-iCre and Acly+/+-Vav-iCre mice. (B) Total thymocyte count in Aclyflox/flox-Vav-iCre and Acly+/+-Vav-iCre mice. (C-D) Representative plots (C) and quantification (D) of CD4CD8 (DN), CD4+CD8+ (DP), CD4+CD8 (CD4), and CD4CD8+ (CD8) populations in the thymus from Aclyflox/flox-Vav-iCre and Acly+/+-Vav-iCre mice. (E-F) Representative plots (E) and quantification (F) of CD44+CD25 (DN1), CD44+CD25+ (DN2), CD44CD25+ (DN3), and CD25CD44 (DN4) populations in the thymus from Aclyflox/flox-Vav-iCre and Acly+/+-Vav-iCre mice. No comparison was significant using 2-tailed Student t test. N.S., not significant.
Figure 3.
Figure 3.
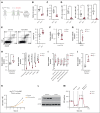
Metabolic consequences of ACLY loss in T-ALL. (A) Schematic of acute Acly deletion experiment in leukemic mice in vivo. (B) Quantitative RT-PCR analysis of Acly mRNA expression in tumor cells isolated from Acly conditional knockout leukemia-bearing mice 72 hours after being treated with vehicle only (Acly+) or tamoxifen (Acly−) in vivo. (C-D) Tumor burden in Acly conditional knockout leukemia-bearing mice 72 hours after being treated with vehicle only (Acly+) or tamoxifen (Acly−) in vivo as revealed by total spleen weight (C) or the infiltration of GFP-positive leukemic cells in the spleen, bone marrow, or meninges (D). (E) Representative flow cytometry plots of annexin V (apoptotic cells) and 7-AAD (dead cells) staining (left) and quantification of apoptosis (right) in leukemic spleens from Acly conditional knockout leukemia-bearing mice 48 hours after being treated with vehicle only (Acly+) or tamoxifen (Acly−) in vivo (n = 4-5 per treatment in panels B-E; ∗P < .05 and ∗∗∗P < .005 using 2-tailed Student t test). (F-G) Relative acetyl-CoA (F) and AICAR (G) abundance upon isogenic loss of Acly in leukemic spleens 48 to 72 hours after being treated with vehicle only (Acly+) or tamoxifen (Acly−) in vivo. (H) Relative abundance of the indicated pyrimidine intermediates upon tamoxifen-induced isogenic loss of Acly in leukemic spleens from mice treated as in panel A. (I) Relative abundance of the indicated glycolytic intermediates upon tamoxifen-induced isogenic loss of Acly in leukemic spleens from mice treated as in panel A. (J) Relative abundance of glutathione disulfide upon tamoxifen-induced isogenic loss of Acly in leukemic spleens from mice treated as in panel A. (K-L) Growth curve (K) and western blot analyses of ACLY and ACTIN expression (L) in an Acly conditional knockout T-ALL cell line in vitro upon treatment with ethanol (control) or 4-hydroxytamoxifen (4OHT) to induce ACLY loss. (M) Oxygen consumption rate OCR in Acly conditional knockout T-ALL cells, under basal conditions or after 4OHT-induced loss of ACLY, measured in real-time using a Seahorse XF24 instrument. Data are presented as mean ± standard deviation of n = 4 wells. n = 6 to 8 per treatment in panels F-G and n = 4 to 5 per treatment in panels H-J; ∗P < .05; ∗∗P < .01; ∗∗∗P < .005 using 2-tailed Student t test. AICAR, 5-aminoimidazole-4-carboxamide ribonucleotide; d, day; min, minutes; FCCP, carbonyl cyanide-p-trifluoromethoxyphenylhydrazone; OCR, oxygen consumption rate.
Figure 4.
Figure 4.
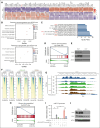
ACLY-MYC axis in T-ALL. (A) Heat map representation of the top differentially expressed genes between control (Acly+) and tamoxifen-treated (Acly−) Acly conditional knockout T-ALL. Cutoffs used: top 40 up and downregulated genes; P adjusted value <.0001; log-fold change >1. Scale bar illustrates color-coded differential expression, with red indicating higher and blue indicating lower levels of expression. (B) Pathway analyses of significantly downregulated or upregulated genes upon ACLY loss using enrichplot (https://bioconductor.org/packages/release/bioc/html/enrichplot.html). (C) Enrichr analyses of transcription factors controlling downregulated pathways upon ACLY loss. (D) GSEA of genes downregulated by N-Me loss in control (vehicle-only treated; ACLY ON) or Acly-deleted leukemias (tamoxifen treated; ACLY OFF) in vivo. (E) Western blot analyses of ACLY, MYC, and ACTIN expression 72 hours after tamoxifen-induced deletion of Acly in vivo. (F) Heat map representation of genome-wide enrichment for H3K27ac (left), H3K4me3 (middle), and H3K9ac (right) marks in control (vehicle treated; ACLY ON) or Acly-deleted leukemias (tamoxifen treated; ACLY OFF) in vivo. The color of the heat map indicates the number of CPM-normalized reads within ±3000 bp of annotated Transcription Start Site (TSS) for each gene. (G) Epigenetic profiling around the Myc promoter revealing ChIP-seq tracks for the indicated histones marks in mouse T-ALL leukemic samples treated as in panel F. (H) GSEA of genes downregulated by ACLY loss in control (vehicle treated; N-Me ON) or N-Me–deleted leukemias (tamoxifen treated; N-Me OFF) in vivo. (I) Luciferase reporter activity in 293T cells of a pGL4 promoter empty construct (pGL4-Luc) or a pGL4 promoter plus the human ACLY promoter, in the presence or absence of MYC overexpression or treatment with JQ1. Data from 3 independent transfection replicates are shown ∗∗∗P < .005 using 2-tailed Student t test. (J) Western blot analyses of ACLY, MYC, and ACTIN expression 48 hours after tamoxifen-induced deletion in vitro of N-Me using an N-Me conditional knockout T-ALL cell line.
Figure 5.
Figure 5.
Antileukemic effects of ACLY pharmacological inhibition in human T-ALL. (A) Effects on cell survival in different human T-ALL cell lines upon 3 days of treatment with ethanol (Et-OH; control) or the ACLY inhibitor BMS-303141 in vitro. (B) Western blot analyses of ACLY, MYC, and ACTIN expression 24 hours after treatment with ethanol or BMS-303141 in the same human cell lines. (C) Effects on cell survival in human T-ALL PDX PDTALL 19 upon 3 days of treatment with ethanol or BMS-303141 in vitro. (D) Western blot analyses of ACLY, MYC, and ACTIN expression 24 hours after treatment with ethanol or BMS-303141 in the same PDX. (E) Kaplan-Meier survival curves of immunodeficient mice transplanted with PDTALL 19 and treated with vehicle or BMS-303141 on a 5-day on and 2-day off schedule (n = 7-8 per group). ∗∗∗P < .005 in panels A,C using 2-tailed Student t test; ∗P < .05 in panel E calculated with log-rank test.

References

    1. Pagliaro L, Chen SJ, Herranz D, et al. Acute lymphoblastic leukaemia. Nat Rev Dis Primers. 2024;10(1):41. - PubMed
    1. Rashkovan M, Ferrando A. Metabolic dependencies and vulnerabilities in leukemia. Genes Dev. 2019;33(21-22):1460–1474. - PMC - PubMed
    1. Garcia-Canaveras JC, Lancho O, Ducker GS, et al. SHMT inhibition is effective and synergizes with methotrexate in T-cell acute lymphoblastic leukemia. Leukemia. 2021;35(2):377–388. - PMC - PubMed
    1. da Silva-Diz V, Cao B, Lancho O, et al. A novel and highly effective mitochondrial uncoupling drug in T-cell leukemia. Blood. 2021;138(15):1317–1330. - PMC - PubMed
    1. Herranz D, Ambesi-Impiombato A, Sudderth J, et al. Metabolic reprogramming induces resistance to anti-NOTCH1 therapies in T cell acute lymphoblastic leukemia. Nat Med. 2015;21(10):1182–1189. - PMC - PubMed

LinkOut - more resources