Comprehensive Analysis of the Role of Metabolic Features in Osteoporosis: A Multi-Omics Analysis
- PMID: 40453197
- PMCID: PMC12124299
- DOI: 10.2147/IJGM.S515717
Comprehensive Analysis of the Role of Metabolic Features in Osteoporosis: A Multi-Omics Analysis
Abstract
Purpose: This study aims to comprehensively explore the metabolic features related to the pathogenesis of osteoporosis (OP) through multi-omics analysis strategy.
Patients and methods: Gene expression profiles of OP patients (GSE56815) were downloaded from GEO, and metabolism-related genes (MRGs) were extracted. Plasma samples from 45 OP patients and 18 healthy controls (CON) were collected for metabolomics. We predicted miRNA and transcription factors (TFs) regulating the expression of MRGs on public databases ENCORI and JASPAR, and analyzed the expression levels of target miRNAs using miRNA sequencing of femoral tissues from 7 samples (OP:CON=4:3). Three machine learning algorithms were used to evaluate the diagnostic potential of metabolic signatures for OP.
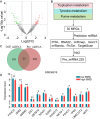
Results: A total of 402 significantly differentially expressed MRGs (DEMRGs) were identified in the transcriptome, and these DEMRGs were enriched in 11 metabolic pathways (P<0.05). Metabolomics identified 119 differential plasma metabolites, enriched in 5 metabolic pathways (P<0.05). Purine metabolism, Tryptophan metabolism, and Tyrosine metabolism were identified as key metabolic pathways and were significantly enriched in DEMRGs. Femoral miRNA sequencing found 124 differentially expressed miRNAs, with 23 regulating key metabolic pathway gene expression (P<0.05). Additionally, 13 differentially expressed TFs were predicted to regulate the expression levels of these 23 miRNAs. Finally, three MRGs and one plasma metabolite were selected based on the machine learning algorithm, with AUC of 0.782, 0.714, 0.772 and 0.836, respectively. The diagnostic performance of these metabolic features was better than that of traditional bone metabolism biochemical markers.
Conclusion: This multi-omics study comprehensively explores the metabolic landscape in OP progression, highlighting the central role of metabolic features in the disease. The constructed multi-omics regulatory network aids in understanding the molecular mechanisms of metabolic features in OP progression.
Keywords: biomarkers; machine learning; metabolic features; multi-omics analysis; osteoporosis.
© 2025 Chang et al.
Conflict of interest statement
All the authors declare no conflict of interest in this work.
Figures


Similar articles
-
Comprehensive analysis of the m6A-related molecular patterns and diagnostic biomarkers in osteoporosis.Front Endocrinol (Lausanne). 2022 Aug 10;13:957742. doi: 10.3389/fendo.2022.957742. eCollection 2022. Front Endocrinol (Lausanne). 2022. PMID: 36034449 Free PMC article.
-
Identification of mitophagy-related biomarkers in human osteoporosis based on a machine learning model.Front Physiol. 2024 Jan 8;14:1289976. doi: 10.3389/fphys.2023.1289976. eCollection 2023. Front Physiol. 2024. PMID: 38260098 Free PMC article.
-
Identification and validation of metabolism-related hub genes in idiopathic pulmonary fibrosis.Front Genet. 2023 Feb 27;14:1058582. doi: 10.3389/fgene.2023.1058582. eCollection 2023. Front Genet. 2023. PMID: 36923791 Free PMC article.
-
Identification of a Potential MiRNA-mRNA Regulatory Network for Osteoporosis by Using Bioinformatics Methods: A Retrospective Study Based on the Gene Expression Omnibus Database.Front Endocrinol (Lausanne). 2022 May 10;13:844218. doi: 10.3389/fendo.2022.844218. eCollection 2022. Front Endocrinol (Lausanne). 2022. PMID: 35620387 Free PMC article.
-
Bioinformatics analysis of oxidative phosphorylation-related differentially expressed genes in osteoporosis.Eur J Med Res. 2025 Apr 16;30(1):294. doi: 10.1186/s40001-025-02568-6. Eur J Med Res. 2025. PMID: 40241169 Free PMC article.
References
LinkOut - more resources
Full Text Sources
Miscellaneous

