. 2025 May 16:19:1514937.
doi: 10.3389/fncir.2025.1514937. eCollection 2025.

The striatal compartments, striosome and matrix, are embedded in largely distinct resting-state functional networks

Affiliations

The striatal compartments, striosome and matrix, are embedded in largely distinct resting-state functional networks

Alishba Sadiq et al. Front Neural Circuits. .

Abstract

The striatum is divided into two interdigitated tissue compartments, the striosome and matrix. These compartments exhibit distinct anatomical, neurochemical, and pharmacological characteristics and have separable roles in motor and mood functions. Little is known about the functions of these compartments in humans. While compartment-specific roles in neuropsychiatric diseases have been hypothesized, they have yet to be directly tested. Investigating compartment-specific functions is crucial for understanding the symptoms produced by striatal injury, and to elucidating the roles of each compartment in healthy human skills and behaviors. We mapped the functional networks of striosome-like and matrix-like voxels in humans in-vivo. We utilized a diverse cohort of 674 healthy adults, derived from the Human Connectome Project, including all subjects with complete diffusion and functional MRI data and excluding subjects with substance use disorders. We identified striatal voxels with striosome-like and matrix-like structural connectivity using probabilistic diffusion tractography. We then investigated resting-state functional connectivity (rsFC) using these compartment-like voxels as seeds. We found widespread differences in rsFC between striosome-like and matrix-like seeds (p < 0.05, family wise error corrected for multiple comparisons), suggesting that striosome and matrix occupy distinct functional networks. Slightly shifting seed voxel locations (<4 mm) eliminated these rsFC differences, underscoring the anatomic precision of these networks. Striosome-seeded networks exhibited ipsilateral dominance; matrix-seeded networks had contralateral dominance. Next, we assessed compartment-specific engagement with the triple-network model (default mode, salience, and frontoparietal networks). Striosome-like voxels dominated rsFC with the default mode network bilaterally. The anterior insula (a primary node in the salience network) had higher rsFC with striosome-like voxels. The inferior and middle frontal cortices (primary nodes, frontoparietal network) had stronger rsFC with matrix-like voxels on the left, and striosome-like voxels on the right. Since striosome-like and matrix-like voxels occupy highly segregated rsFC networks, striosome-selective injury may produce different motor, cognitive, and behavioral symptoms than matrix-selective injury. Moreover, compartment-specific rsFC abnormalities may be identifiable before disease-related structural injuries are evident. Localizing rsFC differences provides an anatomic substrate for understanding how the tissue-level organization of the striatum underpins complex brain networks, and how compartment-specific injury may contribute to the symptoms of specific neuropsychiatric disorders.

Keywords: compartment; diffusion tractography; functional MRI; functional connectivity; matrix; striatum; striosome; structural connectivity.


Conflict of interest statement

The authors declare that the research was conducted in the absence of any commercial or financial relationships that could be construed as a potential conflict of interest.

Figures
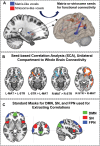
FIGURE 1
FIGURE 1
Framework for the investigation of compartment-specific differences in resting-state functional connectivity. (A) This sagittal section of the brain illustrates striosome-like (red) and matrixlike (blue) voxels, defined by differential structural connectivity. These voxels were used as seeds for functional connectivity analysis, identifying regions where matrix-like voxels show greater connectivity than striosome-like voxels or vice versa (B), with lighter-hued colors indicating stronger differences. (C) Illustrates the nodes utilized to define the triple network: default mode network (DMN—green), salience network (SN—red), and frontoparietal network (FPN—blue). L-MAT, left matrix; LSTR, left striosome; R-MAT, right matrix; R-STR, right striosome.
FIGURE 2
FIGURE 2
Differential structural connectivity can identify striosome-like and matrix-like striatal voxels. (A) The selection of bait regions is based on injected tract-tracing studies in animals, identifying key regions with biased structural connectivity toward one compartment. (B) These identified regions serve as targets for connectivity-based parcellation. We identified five striosome-favoring and five matrix-favoring regions with highly biased connectivity to serve as “bait” for connectivity-based parcellation. (C) Selecting the most-biased voxels from each probability distribution allows us to generate equal-volume masks that serve as the seeds for functional connectivity in subsequent experiments. These methods enable the investigation of compartment-specific functional networks, integrating structural and functional connectivity approaches.
FIGURE 3
FIGURE 3
Compartment-like voxels match the location and relative abundance of striosome and matrix in human tissue. Striosome-like volume (red) is concentrated in the rostral caudate (left) and putamen (right), while matrix-like volume (blue) is distributed throughout the rostral-caudal extent of both nuclei. For each plane, the smaller-volume bar is placed in front of the larger-volume bar—red (striosome-like) in front of blue (matrix-like) for all putaminal planes and most caudate planes. Coronal planes are numbered according to MNI convention. Significance assessed with t-tests, unequal variance: *p < 0.05; **p < 10– 5; ***p < 10– 50. Significance threshold corrected for family wise error.
FIGURE 4
FIGURE 4
Striatal parcellation utilizing all 10 bait regions (A) maps compartment-like bias throughout the striatum. N-1 parcellation [(B); only 9 regions, leaving one out] also identifies compartment-like bias but provides a way to map and quantify the contributions of each bait region. Subtracting these parcellations (All-10 minus N-1) reveals the influence of the left-out region. We performed binary striatal parcellation, comparing each of our 10 N-1 segmentations to identify the largest contributor to bias at each voxel. In axial (C), coronal [(D), left hemisphere], and sagittal planes [(E), left hemisphere], the influence of each bait region followed complex, three-dimensional patterns in both caudate (Ca) and putamen (Pu). Though we parcellated the left and right hemispheres independently, somatotopic zones were highly similar in size, location, and sequence between the hemispheres (C). Zones influenced by matrix-favoring bait regions are shown in shades of blue, while zones influenced by striosome-favoring bait regions are shown in shades of red-yellow. Note that each region influences connectivity outside its somatotopic zone, but less strongly than within its zone. Data is projected on the MNI152_T1_1 mm standard template. Coordinates follow MNI convention.
FIGURE 5
FIGURE 5
Compartment-specific projections target discrete somatotopic zones in the striatum, in complex 3D patterns that are highly similar between left and right hemispheres, seen in axial (A), coronal (B, C), and sagittal (D) views. All masks had similar volume (50–100 voxels); left and right zones for each bait region were matched within a few voxels. Compartment-like volume within these zones (E) demonstrated that each somatotopic zone matched the connectivity pattern (near-exclusive matrix or striosome enriched) found in animal histology. Error bars represent the standard error of the mean. **p = 6.5 × 10– 52, ANOVA. Data is projected on the MNI152_T1_1 mm standard template. Coordinates follow MNI convention.
FIGURE 6
FIGURE 6
Significant differences between striosome- and matrix-seeded networks in the (A) left-matrix (L-MAT), (B) left-striosome (L-STR), (C) right-matrix (R-MAT), and (D) right-striosome (R-STR). Warm colors (red-yellow) indicate regions where striosome-like seeds showed significantly greater rsFC compared to matrix-like seeds; cool colors (blue-light blue) indicate regions where matrix-like seeds showed greater rsFC than striosome-like seeds. Higher t-values indicate higher connectivity. Images are displayed in anatomical convention, where the left hemisphere is shown on the left side of the image.
FIGURE 7
FIGURE 7
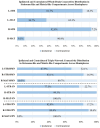
Comparison of ipsilateral and contralateral connectivity patterns in striosome and matrix compartments across hemispheres. The figure shows the distribution of whole-brain (top panel) and triple-network (bottom panel: DMN, default mode network; SN, salience network; FPN, frontoparietal network) connectivity for ipsilateral and contralateral connections within striosome- and matrix-like compartments. Note that the L-MAT had no significant contrasts for DMN, SN, or FPN, so these comparisons are not shown in this figure.
FIGURE 8
FIGURE 8
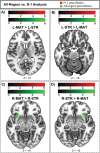
Hemisphere-specific distribution of striosome- and matrix-like compartment rsFC in the triple network. (A) Illustrates the regions where the L-STR exhibits stronger functional connectivity than the L-MAT compartment. (B) Illustrates the regions where the R-STR has stronger connectivity than the R-MAT. (C) Illustrates the regions where the R-MAT has stronger connectivity than the R-STR. Note that the L-MAT > L-STR contrast yielded no significant differences, and therefore is not pictured here. Green indicates regions within the DMN, red indicates regions in the SN, and blue indicates regions in the FPN. The color bars correspond to t-values, with lighter colors reflecting higher t-values and stronger connectivity.
FIGURE 9
FIGURE 9
Compartment-specific bias in functional connectivity could be influenced by the use of the anterior insula as a bait region and subsequently as a site for whole-brain and salience network connectivity. Green voxels (original, all-region parcellation) are displayed in front of red voxels (N-1 parcellation). Connectivity is changed very little by leaving out the anterior insula. (A) The regions where the L-MAT exhibits stronger functional connectivity than the L-STR compartment. (B) Illustrates the regions where the L-STR has stronger connectivity than the L-MAT. (C) The regions where the R-MAT has stronger connectivity than the R-STR. (D) The regions where the R-STR has stronger connectivity than the R-MAT. The color bars correspond to t-values, with lighter colors reflecting higher t-values and stronger connectivity. Green = original parcellation (with anterior insula); Red = N-1 parcellation (leaving out the anterior insula). Images are displayed in anatomical convention, where the left hemisphere is shown on the left side of the image.

Update of

Similar articles

References

    1. Albin R., Young A., Penney J. (1989). The functional anatomy of basal ganglia disorders. Trends Neurosci. 12 366–375. 10.1016/0166-2236(89)90074-x - DOI - PubMed
    1. Barto A. G. (1995). “Adaptive critics and the basal ganglia,” in Models of Information Processing in the Basal, eds Ganglia J. C., Houk J., Beiser D. (Cambridge, MA: MIT Press; ).
    1. Behrens T. E. J., Johansen-Berg H., Woolrich M. W., Smith S. M., Wheeler-Kingshott C. A. M., Boulby P. A., et al. (2003). Non-invasive mapping of connections between human thalamus and cortex using diffusion imaging. Nat. Neurosci. 6, 750–757. 10.1038/nn1075 - DOI - PubMed
    1. Benjamini Y., Hochberg Y. (1995). Controlling the false discovery rate: A practical and powerful approach to multiple testing. J. R. Stat. Soc. Ser. B 57 289–300. 10.1111/j.2517-6161.1995.tb02031.x - DOI
    1. Berendse H., Voorn P., te Kortschot A., Groenewegen H. J. (1988). Nuclear origin of thalamic afferents of the ventral striatum determines their relation to patch/matrix configurations in enkephalin-immunoreactivity in the rat. J. Chem. Neuroanat. 1 3–10. - PubMed

LinkOut - more resources