First validation of the Prostatype® P-score in an Asian cohort: Improving risk stratification for prostate cancer
- PMID: 40453486
- PMCID: PMC12123050
- DOI: 10.1002/bco2.70026
First validation of the Prostatype® P-score in an Asian cohort: Improving risk stratification for prostate cancer
Abstract
Objectives: To evaluate the prognostic performance of the Prostatype® score (P-score) in the Asian prostate cancer (PCa) cohort and to assess its ability to refine risk stratification compared to the National Comprehensive Cancer Network (NCCN) guidelines. This study aimed to determine whether the P-score, previously validated in European populations, maintains its predictive accuracy in a genetically and clinically distinct high-risk Asian cohort, where late-stage diagnosis is more common.
Patients and methods: This retrospective study included 148 PCa patients diagnosed at Taiwan Chang Gung Memorial Hospital between 2012 and 2017. Of these, 56 had primary metastases at diagnosis. The P-score was calculated based on gene expression in core needle biopsies and clinical data collected from patients' medical records. The primary endpoint was PCa-specific mortality (PCSM). The secondary endpoints were adverse pathology (AP) and biochemical failure.
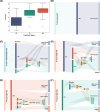
Results: The P-score significantly outperformed NCCN in predicting PCSM, achieving a higher C-index (0.90 vs. 0.73, P < 0.005), which reflects superior prognostic accuracy. Notably, 19.6% of patients were reclassified into different risk categories compared to NCCN, improving risk stratification and potentially altering treatment decisions for nearly one in five patients. The P-score was also an independent predictor of adverse pathology (P = 0.003, AUC: 0.81) and biochemical failure (P = 0.03, AUC: 0.89).
Conclusions: This study validated the P-score for the first time in a non-European population, confirming its predictive power in an Asian high-risk setting. The reclassification of 19.6% of patients suggests that the P-score refines risk stratification beyond NCCN, offering a more precise distinction between favourable and unfavourable outcomes, enabling more informed treatment decisions. These findings highlight the global applicability of the P-score and its potential to improve risk assessment and personalized treatment for PCa patients worldwide.
Keywords: biomarkers; mortality; prostate cancer; risk stratification; therapy.
© 2025 The Author(s). BJUI Compass published by John Wiley & Sons Ltd on behalf of BJU International Company.
Conflict of interest statement
EB is employed by Prostatype Genomics AB. LDX was employed by Prostatype Genomics AB. The authors report no other conflicts of interest in this work.
Figures


References
LinkOut - more resources
Full Text Sources
