MEASURING SCHOOL ECONOMIC DISADVANTAGE
- PMID: 40454000
- PMCID: PMC12121947
- DOI: 10.3102/01623737231217683
MEASURING SCHOOL ECONOMIC DISADVANTAGE
Abstract
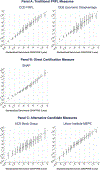
Many educational policies hinge on the valid measurement of student economic disadvantage at the school level. Measures based on free and reduced-price lunch enrollment are used widely. However, recent research raises questions about their reliability, particularly following the introduction of universal free lunch in certain schools and districts. Using unique data linking the universe of students in Oregon public schools to IRS tax records and other data housed at the U.S. Census Bureau, we provide the first examination of how well different measures capture school economic disadvantage. We find that, in Oregon, direct certification provides the best widely-available measure, both over time and across the distribution of school economic disadvantage. By contrast, neighborhood-based measures consistently perform relatively poorly.
Keywords: Economically Disadvantaged Students; Measurement of Poverty; School Economic Disadvantage; School Lunch; Validity.
Figures


References
-
- Bailey MJ, & Dynarski SM (2011). Gains and Gaps: Changing Inequality in U.S. College Entry and Completion (Working Paper No. 17633). National Bureau of Economic Research. 10.3386/w17633 - DOI
-
- Belsha K (2023). More students eating for free as growing number of states offer universal school meals. Chalkbeat, chalkbeat.org/2023/8/10/23827877/free-school-meals-lunch-breakfast-unive...
-
- Burnette II D (2020). “Districts Anxious About Plunge in Meal-Program Applicants,” EdWeek, https://www.edweek.org/leadership/districts-anxious-about-plunge-in-meal...
-
- California Department of Education. (2021). LCFF Frequently Asked Questions. https://s3.amazonaws.com/2019.funded.edbuild.org/public/citations/617_LC...
-
- Clark L and Bhaskar R (2023). Using Administrative Data to Measure the Family Income of School-Aged Children. [Presentation]. Center for Administrative Data Analysis, Irvine, California.
Grants and funding
LinkOut - more resources
Full Text Sources
