. 2025 May 20;7(3):fcaf194.
doi: 10.1093/braincomms/fcaf194. eCollection 2025.

Significant underascertainment in Huntington's disease

Affiliations

Significant underascertainment in Huntington's disease

Sujin Lee et al. Brain Commun. .

Abstract

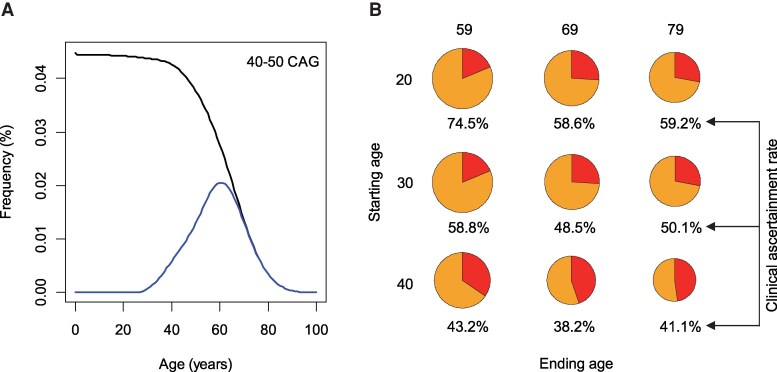
While Huntington's disease (HD), a Mendelian disorder caused by an expanded CAG repeat in HTT, is considered rare, the true prevalence could be significantly higher due to substantial underascertainment. Given inherent biases in empirically assessing disease prevalence, we performed mathematical modelling and validation analyses to estimate the frequency of expanded CAG repeats in the general population to better understand the disease prevalence. We developed an exponential decay model after confirming that the logarithmic decrease in frequency of CAG repeats extends into the pathogenic range (CAG > 35). The model was further refined by incorporating HD onset and mortality probabilities to estimate the clinical ascertainment rate. Our age-adjusted exponential decay model estimated one expanded repeat in 325 people and further showed that the frequency of expanded repeats decreases with age due to the early mortality associated with HD, which was validated by All of Us and UK Biobank data. Importantly, our data suggest that approximately half of symptomatic HD individuals aged 30-70 are not clinically ascertained/diagnosed. Our data, showing higher frequencies of expanded repeats in the general population and significant underascertainment rates, imply that HD prevalence could be twice as high as current estimates.

Keywords: Huntington’s disease; disease prevalence; exponential decay model; frequency of expanded HTT CAG repeat; underascertainment.


Conflict of interest statement

J.F.G. was a Scientific Advisory Board member and had a financial interest in Triplet Therapeutics, Inc. His NIH-funded project is using genetic and genomic approaches to uncover other genes that significantly influence when diagnosable symptoms emerge and how rapidly they worsen in Huntington disease. The company is developing new therapeutic approaches to address triplet repeat disorders such Huntington’s disease, myotonic dystrophy and spinocerebellar ataxias. His interests were reviewed and are managed by Massachusetts General Hospital and Mass General Brigham in accordance with their conflict of interest policies. J.F.G. has also been a consultant for Wave Life Sciences USA, Inc., Biogen, Inc. and Pfizer, Inc. J.-M.L. consults for GenKOre and serves in the scientific advisory board of GenEdit, Inc.

Figures

Graphical Abstract
Graphical Abstract
Figure 1
Figure 1
Estimating the frequency of CAG repeats based on the reported disease prevalence. (A) Histogram showing the distribution of CAG repeat sizes among 7578 clinically ascertained and unrelated Huntington’s disease subjects of European ancestry who participated in previous modifier GWAS studies, representing a total of 15 156 chromosomes. (B) A simulated dataset was generated by combining the 7578 expanded CAG repeats from the study samples with 122 210 406 bootstrapped unexpanded repeats. This simulation assumes that expanded repeats dominantly cause the disease and that all carriers are clinically ascertained. The resulting CAG repeat distribution matches the reported prevalence rate (one in 8064) and is visualized in a histogram, where each bar corresponds to a specific CAG repeat length. (C) The distribution of expanded CAG repeats from the data simulated to match the reported prevalence rate is shown in a zoomed-in histogram to provide a clearer view of the relatively small population of expanded repeats (observed expanded repeats, n = 7578; bootstrapped unexpanded repeats, n = 122 210 406).
Figure 2
Figure 2
Exponential decay model for frequencies of expanded repeats in the general population. (A) The histograms show the distributions of CAG repeat sizes in the 7578 study samples. Separate linear regression models (using statistical analysis ‘lm’ function in R) were fitted to log-transformed counts of unexpanded (left histogram) and expanded (right histogram) CAG repeats to assess whether the frequencies decrease exponentially after 17 CAGs. (B) Exponential decay models for normal (left line) and expanded (right line) CAG repeats are plotted on a logarithmic scale (log10 of % frequency), revealing parallel decay trends. (C) Based on the following observations: (i) the exponential decrease in the frequency of unexpanded repeats; (ii) the continuation of this trend beyond 35 CAGs in large population samples; and (iii) exponential decay patterns being largely parallel for unexpanded and expanded repeats, we constructed an exponential decay model using the frequencies of unexpanded repeats alleles. This model was then extended to the expanded repeat range (dashed line) to estimate the frequencies of expanded repeats in the general population. Each dot represents an observed frequency of individuals carrying expanded CAG repeats (n = 7578).
Figure 3
Figure 3
Age-adjusted exponential decay model. (A) The age-dependent decreased survival in Huntington’s disease (based on statistical analysis ‘survreg’) has been incorporated into the model to generate the age-adjusted exponential decay model. Age adjustments were applied to the 40–50 CAG repeat range, where sufficient sample sizes were available for the Huntington’s disease survival model. Each line represents the frequency of a specific CAG repeat size (40–50 CAG). (B) The age-adjusted exponential decay model was validated against the observed frequency of the repeats in the All of Us data. A simulated population was generated to mimic the age distribution of the All of Us participants (age range, 18–99; n = 425 906), and then the frequencies of expanded repeats in this simulated population were calculated based on the age-adjusted exponential decay model (solid line). A dashed line represents the original exponential decay model, which was used to predict the frequencies of 36–39 CAG repeats. The observed frequencies of expanded repeats in the All of Us dataset (a solid line spanning 20–42 CAGs without a dashed section) were compared to the predicted frequencies from our models using Pearson’s chi-squared test (P-value, 0.260). (C) The same procedures were taken to validate our age-adjusted exponential decay model using UK Biobank data (age range, 37–73; n = 502 618). A dashed line represents the original exponential decay model, which was used to predict the frequencies of 36–39 CAG repeats. The observed frequencies of expanded repeats in the UK Biobank data (a solid line spanning 20–45 CAGs without a dashed section) were compared to the predicted frequencies from our models using Pearson’s chi-squared test (P-value, 0.242). Note that the frequencies of repeats > 40 in All of Us and the UK Biobank began to deviate from our age-adjusted estimate, which was anticipated due to the potential enrichment of healthy individuals in these cohorts.
Figure 4
Figure 4
Significant underascertainment in Huntington’s disease. (A) To calculate the rate of clinical ascertainment, we integrated data for 40–50 CAG repeats into our age-adjusted exponential decay model (based on statistical analysis ‘lm’) alongside onset probability (based on survival analysis using ‘survreg’). The top line represents the frequency of 40–50 CAG repeats combined, while the bottom line indicates the frequency of carriers with disease symptoms. The area under the curve of the bottom line represents the population of individuals carrying 40–50 CAG repeats who have developed symptoms and therefore can be clinically ascertained/diagnosed. (B) Using the frequency of expanded repeats based on the age-adjusted exponential decay model (based on ‘lm’ analysis) and onset probability (based on survival analysis using ‘survreg’), we estimated the percentage of clinical ascertainment based on a simulated population (n = 100 000). Each pie chart shows the proportions of expanded repeat carriers without disease symptoms (bigger pie) and those with disease symptoms (smaller pie) within a specific age range. The percentage of clinical ascertainment for each age range (indicated below each pie chart) was calculated by dividing the reported prevalence rate by the number of carriers with disease symptoms. For example, if the prevalence rate (i.e. one in 8064 people) was determined from a randomly selected 100 000 people aged 30–79, our data suggest that approximately equal number of symptomatic expanded repeat carriers remain unascertained (middle right pie chart).

References

    1. HDCRG . A novel gene containing a trinucleotide repeat that is expanded and unstable on Huntington’s disease chromosomes. The Huntington’s Disease Collaborative Research Group. Cell. 26 1993;72(6):971–983. - PubMed
    1. Bates GP, Dorsey R, Gusella JF, et al. Huntington disease. Nat Rev Dis Primers. 2015;1:15005. - PubMed
    1. Orr HT, Zoghbi HY. Trinucleotide repeat disorders. Annu Rev Neurosci. 2007;30:575–621. - PubMed
    1. Pearson CE, Nichol Edamura K, Cleary JD. Repeat instability: Mechanisms of dynamic mutations. Nat Rev Genet. 2005;6(10):729–742. - PubMed
    1. GeM-HD Consortium . CAG repeat not polyglutamine length determines timing of Huntington’s disease onset. Cells. 2019;178(4):887–900.e14. - PMC - PubMed

LinkOut - more resources