. 2024 Nov 15;2(1):100058.
doi: 10.1016/j.bneo.2024.100058. eCollection 2025 Feb.

Single-cell and spatial characterization of plasmablast-like lymphoma cells in primary central nervous system lymphoma

Affiliations

Single-cell and spatial characterization of plasmablast-like lymphoma cells in primary central nervous system lymphoma

Hiroki Kobayashi et al. Blood Neoplasia. .

Abstract

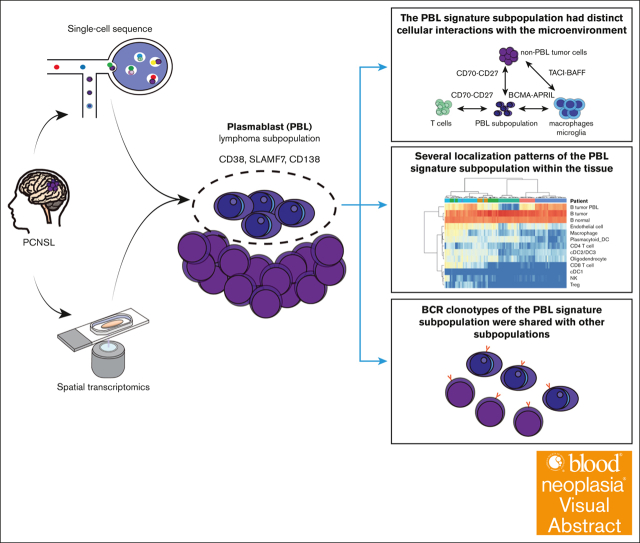
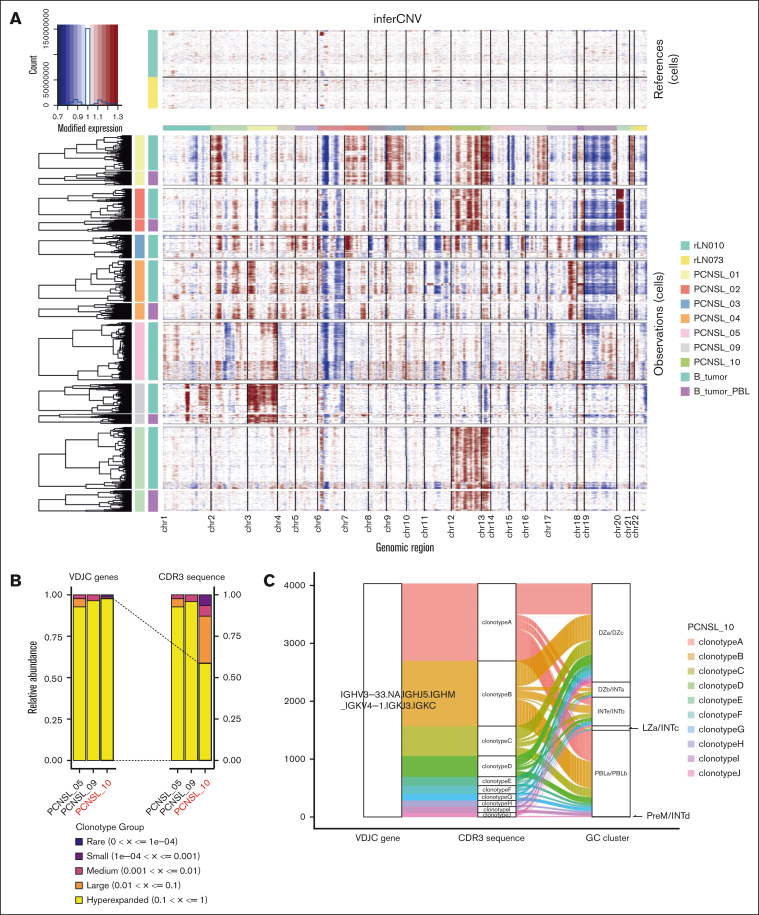
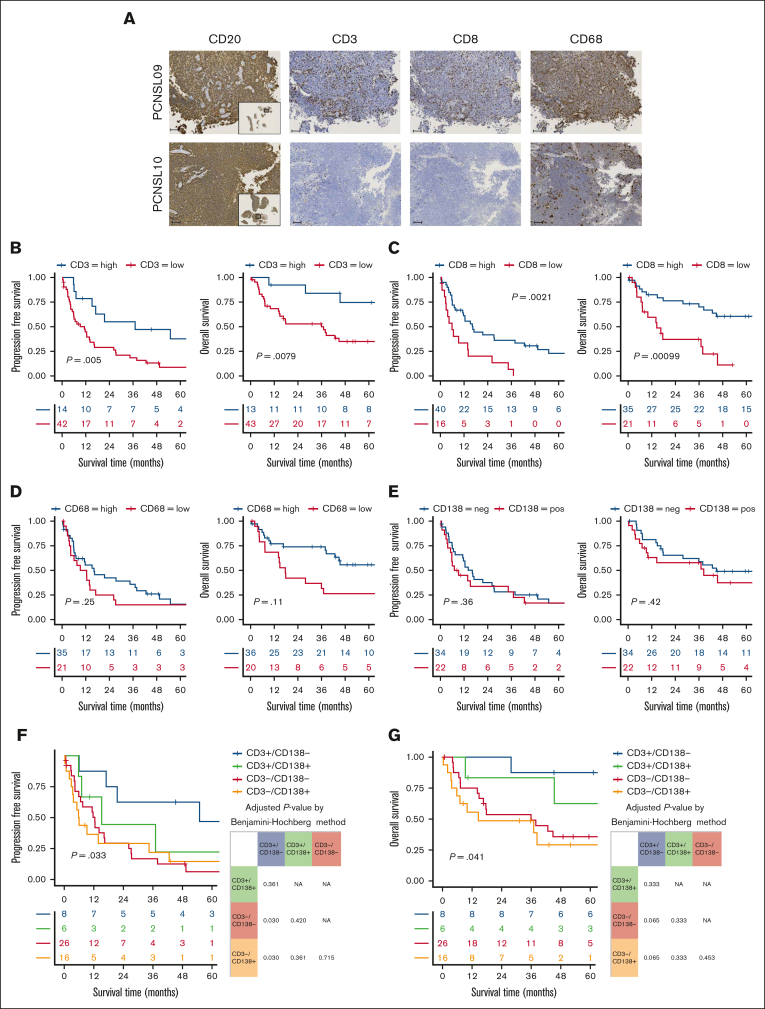
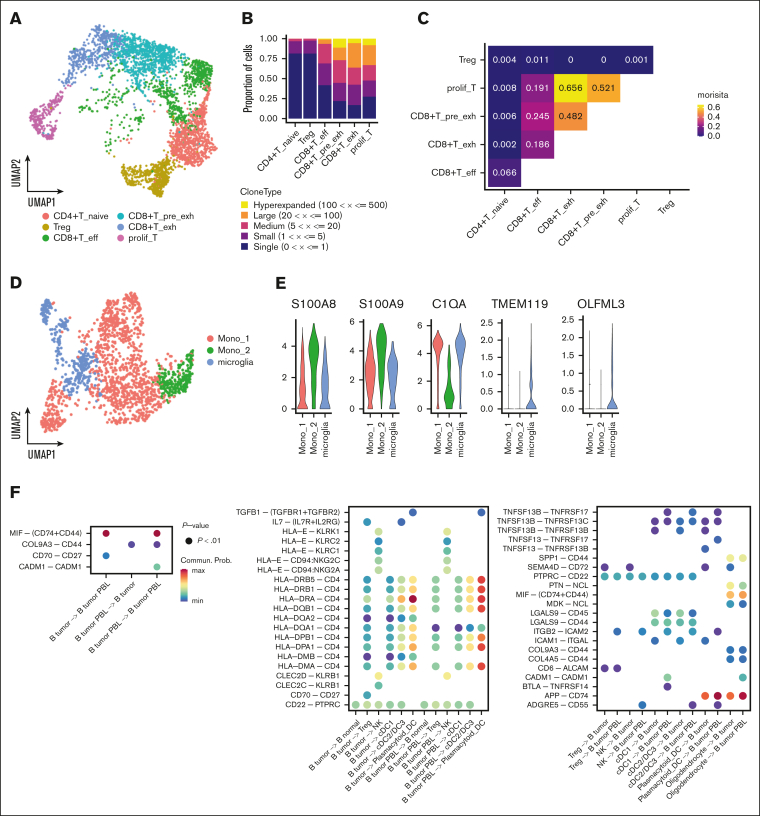
Primary central nervous system lymphoma (PCNSL) is a rare, aggressive type of lymphoma, most often histologically diagnosed as diffuse large B-cell lymphoma (DLBCL). Recent advancements in single-cell sequencing have elucidated that the diverse germinal center states in systemic DLBCL manifest as tumor cell diversity, intricately linked to variations in the microenvironment. However, detailed characterization of intratumoral heterogeneity reflecting B-cell states in PCNSL remains elusive. Here, we conducted single-cell and spatial multiomic analyses to elucidate the cellular and spatial heterogeneity and the microenvironment in PCNSL. We identified a distinctive lymphoma subpopulation with gene and protein expression similar to that of plasmablasts (PBLs), enriched in some patients with PCNSL. B-cell receptor (BCR) analysis revealed that BCR clonotypes of the PBL signature subpopulation were shared with other subpopulations, suggesting a common origin with other lymphoma cell subtypes. Spatial analysis additionally revealed several localization patterns of PBL signature subpopulations within the tissue, indicating spatial heterogeneity. An expansion study showed that ∼40% of patients with PCNSL had a PBL signature subpopulation, as defined by CD138 immunohistochemistry staining. Additionally, patients with a PBL signature subpopulation and low CD3+ cell infiltration exhibited a worse prognosis. Finally, intercellular communication analysis suggested that the PBL signature subpopulation had distinct cellular interactions with the microenvironment. In summary, our study identified a tumor subpopulation with a PBL signature in PCNSL, suggesting distinct molecular and spatial cross talk with the microenvironment. These findings provided new insights into the biological mechanisms of PCNSL.


Conflict of interest statement

Conflict-of-interest disclosure: D.E. reports research funding from Nippon Shinyaku, Chugai, and Eisai; and honoraria from Eisai, Kyowa Kirin, Chugai, SymBio, Bristol Myers Squibb, and Nippon Shinyaku. The remaining authors declare no competing financial interests.

Figures

None
Graphical abstract
Figure 1.
Figure 1.
Landscape of single-cell analysis and interpatient heterogeneity in PCNSL. (A) Schematic of the workflow for single-cell sequencing, spatial transcriptomics, and IHC analyses. (B) Uniform manifold approximation and projection (UMAP) plot of all cells after the integration assay colored according to the cell type. (C) Bar chart shows the proportion of each cell type split by samples. (D) Violin plot of GCB and ABC signature scores based on 2 different gene lists (Scott et al and Reddy et al17). (E) Violin plot shows the distribution of the GCB signature score between tumor and reactive samples. (F) Heat map of the top differentially upregulated genes in each sample. (G) Dot plot shows representative biological pathways enriched in each patient using Gene Ontology Biological Process. (H) Heat map of the top differentially downregulated genes in each sample. DC, dendric cell; NK, natural killer cell; Treg, regulatory T cell.
Figure 2.
Figure 2.
Intratumor heterogeneity and identification of PBL signature lymphoma cells. (A) UMAP plot of B cells colored according to the samples. The black arrow shows the separated cell subpopulation (PBL subcluster). (B) Venn diagram shows the overlap between the DEGs and differential expression proteins (DEPs) of the distinct PBL subcluster compared with other B-cell subclusters. DEPs are displayed. The UMAP plot shows the gene and protein expression levels of CD38, CD39 (ENTPD1), and CD319 (SLAMF7). (C) The UMAP plot shows nonnegative matrix factorization clustering (NMF) based on the GC signature score, and the dot plot shows the representative genes of each GC signature. (D) Dot plot showing the pathway upregulated in GC signature subclusters using WikiPathways. (E) Upper bar chart shows the proportion of the GC signature subcluster in each patient. Lower bar chart shows cell cycle stages in each GC signature subcluster. (F) Dot plot shows the enriched pathways in tumor PBL cells, commonly upregulated pathways in tumor PBL and normal PBL cells, and differentially upregulated pathways in normal PBL cells using WikiPathways. (G) UMAP plot of NMF clustering based on the GC signature score in our data and publicly available single-cell PCNSL data after integration assay (Heming et al and Liu et al9). (H) The pie chart shows the fraction of the PBLa/PBLb cluster originating from each data set. PBL, plasmablast; DEGs, differential expression genes; PreM, precursor memory B-cell; INT, intermediate zone; LZ, light zone; dark zone; UMAP, Uniform Manifold Approximation and Projection.
Figure 3.
Figure 3.
Ongoing somatic hypermutation in PCNSL and the relationship between clonotypes and GC signature subclusters. (A) Heat map showing copy number variation profiles of each sample split into PBL and non-PBL subclusters. Amplification of chromosomal regions is colored in red, whereas deletion of chromosomal regions is shown in blue. (B) Bar chart showing the abundance of clonotypes according to the expansion status of each patient. The sample of PCNSL_10 experienced ongoing somatic hypermutation. (C) Sanky diagram showing the relationship between the clonotypes based on the VDJC gene (left), clonotypes based on the CDR3 sequence (middle), and GC signature subclusters (right) in PCNSL_10. GC, germinal center; PBL, plasmablast; DZ, dark zone; INT, intermediate zone; LZ, light zone; PreM, precursor memory B-cell.
Figure 4.
Figure 4.
Spatial analyses of the heterogeneity of distribution of PBL signature positive cells. (A) Representative immunofluorescence image of GeoMx DSP shows the selected region of interests in PCNSL_09. Blue, nuclei stain (SYTO13); green, anti-CD45; yellow, anti-CD20; red, anti-CD68. Scale bar shows 500 μm. (B) Heat map of the estimated cell proportion in each area of interest (AOI) shows higher variation across samples than within samples. Each column represents an AOI. (C) Representative images of CD20 and CD138 IHC in 2 samples with PBL signature cells. In PCNSL_09, the distribution of CD138+ cells varies within the tumor, whereas in patient 10, CD138+ cells are uniformly distributed throughout the tumor. Small panel of CD20 staining shows an overall image of the tumor. Scale bar shows 200 μm (CD20) or 20 μm (CD138). (D) Representative density map of CD138 IHC in PCNSL_09 and PCNSL_10. Yellow lines represent CD138+ cells. Scale bar shows 200 μm. (E) Spatial feature plot shows the PBL signature score and B cells in publicly available data (Heming et al8). Patient 1 harbors PBL signature lymphoma cells and their distribution varies within the tumor, whereas other patients hardly harbor high PBL score areas. (F) Dot plot shows the logarithmic number of CD138+ cells per square millimeter in each sample. The dotted line denotes the determined cutoff value, derived as the geometric mean of CD138+ cell counts per square millimeter. The term "Diffuse" designates a uniform distribution of CD138+ cells throughout the tumor (the presence of CD138+ cells in more than two-thirds of the CD20+ area). "Localized" indicates a variable distribution of CD138+ cells within the tumor (the presence of CD138+ cells in less than two-thirds of the regions). “Negative” denotes instances where the count of CD138+ cells falls below the established cutoff value. “No overlap” indicates CD138+ cells are present outside the CD20+ regions. PBL, plasmablast; DC, dendric cell; NK, natural killer cell; Treg, regulatory T cell.
Figure 5.
Figure 5.
Low T-cell infiltration PBL signature PCNSL shows unfavorable prognosis. (A) Representative IHC images of 2 samples show tumor cells diffusely positive for CD20 and the variations in the infiltration of CD3+, CD8+, and CD68+ cells. Small panel of CD20 staining shows an overall image of the tumor. Scale bar shows 100 μm. (B) Kaplan-Meier survival curves of PFS (left) and OS (right) for patients with high or low CD3+ infiltration. (C) Kaplan-Meier survival curves of PFS (left) and OS (right) for patients with high or low CD8+ infiltration. (D) Kaplan-Meier survival curves of PFS (left) and OS (right) for patients with high or low CD68+ infiltration. (E) Kaplan-Meier survival curves show no significant difference in PFS (left) or OS (right) between patients with or without CD13+ lymphoma cells. Kaplan-Meier survival curves for PFS (F) and OS (G) according to the presence of CD138+ cells and the degree of CD3+ cell infiltration. The tables show adjusted P value using the Benjamini-Hochberg method, with P values <.05 highlighted in red.
Figure 6.
Figure 6.
Cellular interactions between malignant cells and TME cells. (A) UMAP plot of T-cells colored by T-cell subtypes. (B) Bar chart shows abundance of clonotypes by the expansion status in each T-cell subcluster. (C) Quantification of TCR similarity index (Morisita index) between each pair of T-cell subclusters. (D) UMAP plot of macrophage/microglia colored by the cell subtypes. (E) Violin plot shows the marker gene expression of each subcluster. (F) Left bubble plot shows the significant interaction among tumor B-cells. Middle bubble plot shows the enhanced interaction of the malignant B-cells with the TME. Right bubble plot shows the significant interaction of the immune cells with the tumor B-cells. (G) Chord diagram and violin plot of interactions associated with TNFSF13B (BAFF) and TNFSF13 (APRIL). (H) Chord diagram and violin plot of CD70-CD27 interactions. (I) Chord diagram and violin plot of SPP1-CD44 interactions. CD4+T_naive, CD4+ naïve T-cell; CD8+T_pre_exh, CD8+ pre-exhausted T-cell; CD8+T_eff, CD8+ effector T-cell; CD8+T_exh, CD8+ exhausted T-cell; DC, dendric cell; Mono, monocyte; prolif_T, proliferative T-cell; Treg, regulatory T-cell.
Figure 6.
Figure 6.
Cellular interactions between malignant cells and TME cells. (A) UMAP plot of T-cells colored by T-cell subtypes. (B) Bar chart shows abundance of clonotypes by the expansion status in each T-cell subcluster. (C) Quantification of TCR similarity index (Morisita index) between each pair of T-cell subclusters. (D) UMAP plot of macrophage/microglia colored by the cell subtypes. (E) Violin plot shows the marker gene expression of each subcluster. (F) Left bubble plot shows the significant interaction among tumor B-cells. Middle bubble plot shows the enhanced interaction of the malignant B-cells with the TME. Right bubble plot shows the significant interaction of the immune cells with the tumor B-cells. (G) Chord diagram and violin plot of interactions associated with TNFSF13B (BAFF) and TNFSF13 (APRIL). (H) Chord diagram and violin plot of CD70-CD27 interactions. (I) Chord diagram and violin plot of SPP1-CD44 interactions. CD4+T_naive, CD4+ naïve T-cell; CD8+T_pre_exh, CD8+ pre-exhausted T-cell; CD8+T_eff, CD8+ effector T-cell; CD8+T_exh, CD8+ exhausted T-cell; DC, dendric cell; Mono, monocyte; prolif_T, proliferative T-cell; Treg, regulatory T-cell.

References

    1. Grommes C, Rubenstein JL, DeAngelis LM, Ferreri AJM, Batchelor TT. Comprehensive approach to diagnosis and treatment of newly diagnosed primary CNS lymphoma. Neuro Oncol. 2019;21(3):296–305. - PMC - PubMed
    1. Gandhi MK, Hoang T, Law SC, et al. EBV-associated primary CNS lymphoma occurring after immunosuppression is a distinct immunobiological entity. Blood. 2021;137(11):1468–1477. - PMC - PubMed
    1. Bodor C, Alpar D, Marosvari D, et al. Molecular subtypes and genomic profile of primary central nervous system lymphoma. J Neuropathol Exp Neurol. 2020;79(2):176–183. - PubMed
    1. Holmes AB, Corinaldesi C, Shen Q, et al. Single-cell analysis of germinal-center B cells informs on lymphoma cell of origin and outcome. J Exp Med. 2020;217(10) - PMC - PubMed
    1. Roider T, Seufert J, Uvarovskii A, et al. Dissecting intratumour heterogeneity of nodal B-cell lymphomas at the transcriptional, genetic and drug-response levels. Nat Cell Biol. 2020;22(7):896–906. - PubMed

LinkOut - more resources