. 2024 Nov 15;2(1):100057.
doi: 10.1016/j.bneo.2024.100057. eCollection 2025 Feb.

Cerebrospinal fluid attenuates the efficacy of methotrexate against acute lymphoblastic leukemia cells

Affiliations

Cerebrospinal fluid attenuates the efficacy of methotrexate against acute lymphoblastic leukemia cells

Jongseok Kang et al. Blood Neoplasia. .

Abstract

Treatment and prophylaxis of the central nervous system (CNS) is a standard component of acute lymphoblastic leukemia (ALL) therapy. However, CNS-directed therapies are a significant cause of morbidity, and CNS relapse remains a cause of treatment failure. CNS-directed ALL therapies must target leukemia cells within cerebrospinal fluid (CSF), a fluid that is compositionally distinct from plasma and has been shown to affect leukemia biology. Herein, we demonstrate that human CSF attenuates the potency and efficacy of antifolate drugs including methotrexate, the primary CNS-directed chemotherapeutic for >6 decades. Importantly, this effect of CSF on leukemia methotrexate sensitivity was reversible. Additional mechanistic studies support that diminished proliferation and activation of the integrated stress response in leukemia cells in the CSF may contribute to this resistance. Our findings suggest potential strategies to enhance methotrexate efficacy in CNS-directed ALL therapy and highlight the need to critically reassess even established standards of care.


Conflict of interest statement

Conflict-of-interest disclosure: The authors declare no competing financial interests.

Figures
None
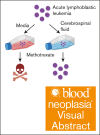
Graphical abstract
Figure 1.
Figure 1.
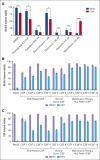
Effects of CSF on ALL drug sensitivity. (A) NALM-6 cells (B-cell ALL) were treated with asparaginase, cytarabine, dexamethasone, doxorubicin, etoposide, or methotrexate in either CSF or regular tissue culture media. Leukemia cell viability was assessed after 48 hours of drug treatment using fixable viability dye staining and flow cytometry. Error bars represent the mean ± standard deviation (SD) of 3 technical replicates. ∗P < .05; ∗∗P < .01; ∗∗∗∗P < .0001 by t test. (B-C) NALM-6 (B) and REH (C) cells were treated with methotrexate 220 nM and 180 nM, respectively, or DMSO in regular media or CSF obtained from patients with extraventricular CSF drains (CSF 1-4), normal donors (CSF 5-6), or patients with ALL undergoing routine lumbar punctures during maintenance therapy (CSF 7-10). Leukemia cell viability was assessed after 48 hours of drug treatment using annexin-V and viability dye staining and flow cytometry. Error bars represent the mean ± SD of 3 technical replicates. When comparing methotrexate toxicity in media vs each CSF sample, P < .0001 by analysis of variance with post hoc Dunnett multiple comparisons test. EVD, extraventricular drain; ns, not significant.
Figure 2.
Figure 2.
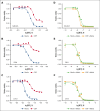
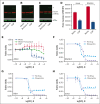
CSF attenuates leukemia cell sensitivity to methotrexate. (A-C) Methotrexate dose-response curves for NALM-6 (A), REH (B), and Jurkat (C) leukemia cells in either regular media or CSF. Leukemia cell viability was assessed after 48 hours of drug treatment using the CellTiter-Glo luminescent cell viability assay, which quantitates adenosine triphosphate as an indicator of viable and metabolically active cells. Error bars represent the mean ± SD of 3 technical replicates. LogIC50 and bottom values with confidence intervals were calculated from the dose-response curves and are shown in the supplemental Table. (D-F) Methotrexate dose-response curves for NALM-6 (D), REH (E), and Jurkat (F) leukemia cells cultured in regular media after 48 hours of preculture in either regular media or CSF. Leukemia cell viability was assessed after 48 hours of drug treatment using the CellTiter-Glo luminescent cell viability assay. Error bars represent the mean ± SD of 3 technical replicates.
Figure 3.
Figure 3.
Palbociclib decreases leukemia cell proliferation and attenuates leukemia cell sensitivity to methotrexate. (A-C) Methotrexate dose-response curves for NALM-6 (A), REH (B), and Jurkat (C) leukemia cells in the absence or presence of palbociclib at varying concentrations. Leukemia cell viability was assessed after 48 hours of drug treatment using the CellTiter-Glo luminescent cell viability assay. Error bars represent the mean ± SD of 3 technical replicates. (D-F) Cell cycle analysis of NALM-6 (D), REH (E), and Jurkat (F) leukemia cells cultured in either CSF or regular media with a palbociclib concentration that caused a level of G0/G1 arrest similar to CSF. Leukemia cells were treated with EdU (5-ethynyl 2’-deoxyuridine) for 30 minutes before fixation, permeabilization, staining, and analysis by flow cytometry. Representative flow cytometry histograms for both CSF and the comparable palbociclib dose are shown. AF, Alexa Fluor.
Figure 4.
Figure 4.
CSF does not influence methotrexate uptake and retention by leukemia cells. (A-C) Trimetrexate dose-response curves for NALM-6 (A), REH (B), and Jurkat (C) leukemia cells treated in either regular media or CSF. Leukemia cell viability was assessed after 48 hours of drug treatment using the CellTiter-Glo luminescent cell viability assay. Error bars represent the mean ± SD of 3 technical replicates. (D-E) Leukemia cells were treated with talotrexin 1 μm (D) or piritrexim 1 μM (E) in either regular tissue culture media or CSF. Leukemia cell viability was assessed after 48 hours of drug treatment using the CellTiter-Glo luminescent cell viability assay. Error bars represent the mean ± SD of 3 technical replicates. ∗∗P < .01; ∗∗∗P < .001; and ∗∗∗∗P < .0001 by t test. (F-H) Fluorescent methotrexate retention in leukemia cells. NALM-6 (F), REH (G), and Jurkat (H) cells loaded with fluorescein-conjugated methotrexate were treated with unlabeled methotrexate 500 nM or DMSO in regular media or CSF. Leukemia cell fluorescence was then measured by flow cytometry at 0, 30, 45, 60, 90, and 120 minutes. Error bars represent the mean ± SD of 3 technical replicates. (I) Methotrexate polyglutamate species 2-4 were measured using LC-MS/MS in Jurkat leukemia cells after treatment with methotrexate 215 nM for 24 hours in either regular media or CSF. ns, not significant by Student t test.
Figure 5.
Figure 5.
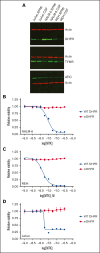
Impact of CSF on the expression of methotrexate target proteins in leukemia cells. (A) Immunoblots showing the effects of CSF on methotrexate target proteins. Leukemia cell lines were cultured in regular media or CSF for 48 hours. Protein lysates were then collected for immunoblotting with DHFR, TYMS, ATIC, or β-actin antibodies. (B-D) Dose-response curves for wild-type (WT) DHFR or mutant DHFR (mDHFR; L22F, F31S) NALM-6 (B), REH (C), and Jurkat (D) leukemia cells treated with different concentrations of the methotrexate. Leukemia cell viability was assessed after 48 hours of drug treatment using the CellTiter-Glo luminescent cell viability assay. Error bars represent the mean ± SD of 3 technical replicates. LogIC50 and bottom values with confidence intervals were calculated from the dose-response curves and are shown in the supplemental Table.
Figure 6.
Figure 6.
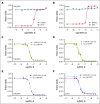
High concentrations of a metabolically active folate derivative rescue methotrexate toxicity. (A-B) Dose-response curves for NALM-6 (A) and Jurkat (B) leukemia cells treated with different concentrations of the folate derivative 5-MTHF in either the absence or presence of methotrexate. Leukemia cell viability was assessed after 48 hours of drug treatment using the CellTiter-Glo luminescent cell viability assay. Error bars represent the mean ± SD of 3 technical replicates. (C-F) Methotrexate dose-response curves for NALM-6 (C,E) and Jurkat (D,F) leukemia cells in either the absence or presence of 5-MTHF 100 nM in either regular media (C-D; RPMI 1640 and 10% FBS) or folate-free media (E-F; folate-free RPMI 1640 and dialyzed 10 % FBS). Leukemia cell viability was assessed after 48 hours of drug treatment using the CellTiter-Glo luminescent cell viability assay. Error bars represent the mean ± SD of 3 technical replicates.
Figure 7.
Figure 7.
CSF activates the ISR. (A-C) Immunoblots showing the effects of CSF on eIF2α levels. NALM-6 (A), REH (B), and Jurkat (C) leukemia cell lines were cultured in regular media or CSF for 24 hours. Cells treated with brefeldin A 2.5 μg/mL in regular media served as a positive control. Protein lysates were then collected for immunoblotting with phospho-eIF2α (p-eIF2α), total eIF2α, or β-actin antibodies. Representative western blots are shown. The p-eIF2α antibody reproducibly detected a higher molecular weight protein of unclear etiology in leukemia cells in CSF, which is denoted by “?” (D) Protein synthesis in leukemia cells was assessed using O-propargyl-puromycin after 48 hours of culture in either regular media or CSF. Error bars represent the mean ± SD of 3 technical replicates. ∗∗∗P < .001 and ∗∗∗∗P < .0001 by t test. (E) Methotrexate dose-response curves for A549 lung carcinoma cells in regular media (Dulbecco modified Eagle medium + 10% FBS), regular media plus tunicamycin 2.5 μg/mL, or CSF. A549 cell viability was assessed after 48 hours of drug treatment using the CellTiter-Glo luminescent cell viability assay. Error bars represent the mean ± SD of 3 technical replicates. (F-H) Methotrexate dose-response curves for NALM-6 (F), REH (G), and Jurkat (H) leukemia cells in the absence or presence of doxycycline 7.5 μM. Leukemia cell viability was assessed after 48 hours of drug treatment using the CellTiter-Glo luminescent cell viability assay. Error bars represent the mean ± SD of 3 technical replicates. LogIC50 and bottom values with confidence intervals were calculated from the dose-response curves and are shown in the supplemental Table.

Similar articles

References

    1. Pui C-H, Thiel E. Central nervous system disease in hematologic malignancies: historical perspective and practical applications. Semin Oncol. 2009;36(4 suppl 2):S2–S16. - PMC - PubMed
    1. Thastrup M, Duguid A, Mirian C, Schmiegelow K, Halsey C. Central nervous system involvement in childhood acute lymphoblastic leukemia: challenges and solutions. Leukemia. 2022;36(12):2751–2768. - PMC - PubMed
    1. Thastrup M, Marquart HV, Schmiegelow K. Flow cytometric detection of malignant blasts in cerebrospinal fluid: a biomarker of central nervous system involvement in childhood acute lymphoblastic leukemia. Biomolecules. 2022;12(6):813. - PMC - PubMed
    1. Whiteside JA, Philips FS, Dargeon HW, Burchenal JH. Intrathecal amethopterin in neurological manifestations of leukemia. AMA Arch Intern Med. 1958;101(2):279–285. - PubMed
    1. Balis FM, Poplack DG. Central nervous system pharmacology of antileukemic drugs. Am J Pediatr Hematol Oncol. 1989;11(1):74–86. - PubMed

LinkOut - more resources