. 2025 Nov;104(12):1415-1424.
doi: 10.1177/00220345251336191. Epub 2025 Jun 2.

Wnt1's Differential Effects on Craniofacial Bone and Tooth Development

Affiliations

Wnt1's Differential Effects on Craniofacial Bone and Tooth Development

R Mahmoud et al. J Dent Res. 2025 Nov.

Abstract

The development of craniofacial bones and teeth relies heavily on the Wnt signaling pathway, yet the specific mechanisms and Wnt variants involved remain under continual investigation. Using publicly available single-cell sequencing data from the mouse incisor, we reveal Wnt1 expression across dental structures and investigate its role using a Col1a1-dependent Wnt1 transgenic mouse model. Inducing Wnt1 early on affects craniofacial bone without disturbing tooth development, but prolonged embryonic induction leads to postnatal mortality with osteopetrosis-like bone overgrowth and malformed teeth. While tooth formation was initially unaffected by postnatal Wnt1 induction, prolonged activation impaired tooth root formation and odontoblast differentiation, resulting in shortened roots and thinner dentin. Three-dimensional micro-computed tomography quantification reveal that both embryonic and postnatal activation of Wnt1 significantly increase neural crest-derived craniofacial bone volume, whereas mesenchymal-derived craniofacial bones are unaffected. Importantly, osteoclastogenesis is suppressed by Wnt1 in a dose-dependent manner, revealed through bulk RNA sequencing and in vitro experiments. These findings emphasize the differential effects of Wnt1 on bone development based on origin and highlight its role in modulating osteoclast activity, indicating broader implications for craniofacial development and potential therapeutic avenues.

Keywords: Wnt1 activation; enamel; osteoanabolic; osteoclastogenesis; osteopetrosis-like pathology; transgenic mouse model.


Conflict of interest statement

Declaration of Conflicting InterestsThe authors declared no potential conflicts of interest with respect to the research, authorship, and/or publication of this article.

Figures
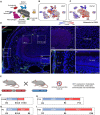
Figure 1.
Figure 1.
Wnt1 expression in the murine incisor and experimental overview. (A) Published single-cell RNA sequencing dataset generated from the murine incisor mesenchyme highlighted different dental cell clusters. In the pagoda plot, blue indicates below-average expression, white represents the baseline, and red shows above-average expression, with the baseline defined as the average expression of the particular gene across all cells (modified from Krivanek et al. 2020). Individual cell transcriptomes were captured with the Smart-seq2 protocol to obtain high sequencing depth. Clustering using PAGODA revealed 17 major cell subpopulations, including the major immune, epithelial, and mesenchymal compartments. Validations and mapping of unbiasedly identified populations was based on the expression of selected marker genes in Krivanek et al. (2020). (B) Expression of Wnt1 in these cell clusters. (C) Expression of Col1a1 in the same cell clusters, created using the following published analysis: http://pklab.med.harvard.edu/cgi-bin/R/rook/tooth.general1/index.html. (D) Wnt1 expression in the region surrounding the cervical loop of an adult mouse incisor was assessed using RNA-Scope. LaCL, labial cervical loop; preAm, preameloblasts scale bar overview = 100 µm scale bar zoom inset = 20 µm. (E) Schematic presentation of the mating conditions and Wnt1 activation in transgenic mice (created in BioRender; https://BioRender.com/x42i303). (F–I) Schematic representation of the feeding regime used in this article. (F) E10.5 mouse embryos were deprived of doxycycline to induce the expression of Wnt1 until E15.5 (details are presented in Appendix Fig. 3). (G) E10.5 mouse embryos were deprived of doxycycline to induce the expression of Wnt1 until birth, where P0 pups were analyzed (details are presented in Fig. 2). (H) Schematic representation of the feeding regime showing the induced activation of Wnt1 at P0 by depriving doxycycline until mice were sacrificed at day 14 (details are presented in Appendix Fig. 8). (I) Schematic representation of the feeding regime showing the induced activation of Wnt1 at P0 by depriving doxycycline until mice were sacrificed at day 28 (details are presented in Fig. 3).
Figure 2.
Figure 2.
Bone and tooth malformations in P0 Wnt1Tg mice following 8 days of Wnt1 activation during embryonic development. (A) Three-dimensional (3D) segmentation of all major craniofacial bones of P0 Wnt1Tg pups and control skulls. (B) Quantification of all major neural crest–, mesoderm-, and mixed-derived bone. (C) Upper panel: 3D segmentation of mandibular molars and incisor of P0 Wnt1 pups and control. Middle panel: Micro–computed tomography (micro-CT) sagittal sections and (lower panel) pentachrome staining of P0 pups showing excessive bone formation (red arrow). Scale bar = 1 mm. (D) Representative images of mandibula tartrate-resistant acid phosphatase (TRAP) staining in P0 Wnt1Tg and control (lower panels) show higher magnification of the regions marked by the black rectangles. Scale bar = 100 µm. (E–H) Micro-CT quantification of (E) incisor volume, (F) incisor length, (G) molar volume, and (H) osteoclast quantification in TRAP staining in control and P0 Wnt1Tg pups. n = 4, except for B and H: n = 3. *P < 0.05, **P < 0.01, ***P < 0.001.
Figure 3.
Figure 3.
Long activation of Wnt1 after birth leads to craniofacial bone and tooth root alterations. (A) Three-dimensional (3D) segmentation of all major craniofacial bones of P28 Wnt1Tg pups and control skulls. (B) Quantification of all major neural crest–, mesoderm-, and mixed-derived bone. (C) Upper panel: 3D segmentation of mandibular molars and incisor of P28 Wnt1Tg pups and control. Middle panel: Micro–computed tomography (micro-CT) sagittal sections and (lower panel) pentachrome staining of P28 pups showing excessive bone formation (red arrow). Scale bar = 1 mm. (D) Representative images of mandibular tartrate-resistant acid phosphatase (TRAP) staining in P28 Wnt1Tg and control (lower panels) show higher magnification of the regions marked by the black rectangles. Scale bar = 100 µm. (E–H) Micro-CT quantification of (E) incisor volume, (F) molar volume, (G) root length, and (H) osteoclast quantification in TRAP staining in control and P28 Wnt1Tg pups. n = 4, except for E and H: n = 3, *P < 0.05, **P < 0.01, ***P < 0.001.
Figure 4.
Figure 4.
Molecular insights into Wnt1 activation at developmental stages P0, P14, and P28. (A) Volcano plot showing differentially up- and downregulated genes with |log2fc| > 1 in P0 Wnt1Tg versus control. (B) Volcano plot showing differentially up- and downregulated genes with |log2fc| > 1 in P14 Wnt1Tg versus control. (C) Volcano plot showing differentially up- and downregulated genes with |log2fc| > 1 in P28 Wnt1Tg versus control. (D–F) Volcano plots showing ligands, receptors, signaling proteins, and inhibitors involved in the Wnt signaling pathway at developmental stages (D) P0, (E) P14, and (F) P28.
Figure 5.
Figure 5.
Effect of Wnt1 on osteoclast differentiation and gene expression in bone marrow cells and osteoblast/osteoclast co-cultures. (A) Tartrate-resistant acid phosphatase (TRAP) staining of isolated bone marrow cells incubated for 8 d with various concentrations of Wnt1/sFRP1 in combination with M-CSF and Rankl. (B) Quantification of the number of osteoclasts in each well. (C) Relative expression of Rank using quantitative polymerase chain reaction (qPCR). (D) Relative expression of Acp5 using qPCR. (E) Relative expression of Ctsk using qPCR. n = 4, *P < 0.05, **P < 0.01. (F) Representative images of TRAP staining from osteoblast/osteoclast co-culture experiments. (G) Relative expression of Wnt1 using qPCR. (H) Relative expression of Acp5 using qPCR. (I) Relative expression of Ctsk using qPCR. (J) Relative expression of Rank using qPCR. (K) Relative expression of Atp6v0d2 using qPCR. (L) Relative expression of Clcn7 using qPCR. n = 6, *P < 0.05, **P < 0.01.

References

    1. Achilleos A, Trainor PA. 2015. Mouse models of rare craniofacial disorders. Curr Top Dev Biol. 115:413–458. - PMC - PubMed
    1. Adaimy L, Chouery E, Mégarbané H, Mroueh S, Delague V, Nicolas E, Belguith H, De Mazancourt P, Mégarbané A. 2007. Mutation in WNT10A is associated with an autosomal recessive ectodermal dysplasia: the odonto-onycho-dermal dysplasia. Am J Human Genet. 81(4):821–828. - PMC - PubMed
    1. Banerjee S, Gordon L, Donn TM, Berti C, Moens CB, Burden SJ, Granato M. 2011. A novel role for MuSK and non-canonical Wnt signaling during segmental neural crest cell migration. Development. 138(15):3287–3296. - PMC - PubMed
    1. Berger H, Wodarz A, Borchers A. 2017. PTK7 faces the Wnt in development and disease. Front Cell Dev Biol. 5:31. doi: 10.3389/fcell.2017.00031 - DOI - PMC - PubMed
    1. Bohring A, Stamm T, Spaich C, Haase C, Spree K, Hehr U, Hoffmann M, Ledig S, Sel S, Wieacker P, et al. 2009. Wnt10A mutations are a frequent cause of a broad spectrum of ectodermal dysplasias with sex-biased manifestation pattern in heterozygotes. Am J Human Genet. 85(1):97–105. - PMC - PubMed

LinkOut - more resources