. 2025 Jun 2;135(11):e184158.
doi: 10.1172/JCI184158.

PIEZO1 mediates periostin+ myofibroblast activation and pulmonary fibrosis in mice

Affiliations

PIEZO1 mediates periostin+ myofibroblast activation and pulmonary fibrosis in mice

Liran Xu et al. J Clin Invest. .

Abstract

Idiopathic pulmonary fibrosis (IPF) is a devastating interstitial lung disease characterized by the excessive accumulation of activated myofibroblasts that deposit extracellular matrix (ECM) protein, leading to progressive scar formation and mechanical stress. However, the cellular origin and fate of myofibroblasts remain controversial, and the mechanisms by which myofibroblasts sense mechanical cues in the lung are unclear. Here, we report that periostin (Postn) is a reliable and distinctive marker for pulmonary myofibroblasts, while ablation of Postn+ myofibroblasts after injury ameliorated lung fibrosis. PIEZO1 was highly expressed in Postn+ myofibroblast and played a vital role in mechanoactivation of Postn+ myofibroblast and development of lung fibrosis. Conditional deletion of Piezo1 in Postn+ myofibroblasts significantly inhibited lung fibrosis by suppressing myofibroblast activation and proliferation. Loss of Piezo1 led to disruption of actin organization and prevention of Yap/Taz nuclear localization, thus shifting the myofibroblasts from a proliferative state into a stressed and apoptotic state. Furthermore, myofibroblast-specific Yap/Taz deletion fully recapitulated the protective phenotypes of myofibroblast-Piezo1-KO mice. These findings show that periostin marks pulmonary myofibroblasts, and that PIEZO1-mediated mechanosensation is essential for myofibroblast activation in the lung. Targeting PIEZO1 in the periostin-expressing cells is a novel therapeutic option to interfere with fibrotic diseases such as IPF .

Keywords: Cell biology; Fibrosis; Ion channels; Pulmonology.


Figures
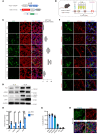
Figure 1
Figure 1. Postn+ cell lineage tracing during lung fibrosis.
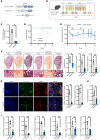
(A) Schematic representation showing the genetic strategy for the generation of the Postn-CreERT2; mT/mG mice for lineage tracing. (B) Schematic diagram of the experimental design. Postn-CreERT2; mT/mG mice were challenged to a single intratracheal inhalation of 1 U/kg BLM followed by injection with tamoxifen on 5 consecutive days. The control mice (Postn-CreERT2; mT/mG) without BLM injury (–BLM) were induced by 5 consecutive days tamoxifen and analyzed at day 21 after tamoxifen injection. (C) Representative images of Postn+ lineage GFP+ cells in Postn-CreERT2; mT/mG mice after tamoxifen treatment and BLM challenge. Immunofluorescent staining showing tdTomato and GFP single channels in addition to a merged image. Scale bar: 20 μm. (D and E) Western blot analysis (D) and quantification (E) of the indicated protein levels in the lung of mice at 21 days post bleomycin injury (d.p.i.). n = 4–8. (F) Representative images to identify the Postn+ cells in the mouse lung sections. Antibodies against the stromal markers (α-SMA, Desmin, Pdgfr-β, and Pdgfr-α), endothelial marker CD31, and alveolar type 1 (AT1) cell marker Rage were costained in the lung sections of Postn-CreERT2; mT/mG mice at 21 d.p.i. Scale bar: 20 μm. (G) Quantification of colocalization of the GFP+ cells with α-SMA+, Desmin+, Pdgfr-β+, Pdgfr-α+, CD31+, or Rage+ cells in the lung sections of Postn-CreERT2; mT/mG mice at 21 d.p.i. n = 10. (H) Representative images of Postn expression, which were costained with α-SMA in the lung sections of patients with IPF. Scale bar: 20 μm. n = 8. Shown are mean values ± SEM. Statistical significance was determined by unpaired Student’s t test or the Mann-Whitney U test. ***P < 0.001.
Figure 2
Figure 2. Postn+ cell ablation mitigates BLM-induced pulmonary fibrosis in mice.
(A) Schematic representation showing the genetic strategy for generation of the Postn-CreERT2; R26-iDTR mice for ablation of Postn+ cells. (B) Schematic diagram of the experimental design. Postn-CreERT2; R26-iDTR were challenged to a single intratracheal inhalation of BLM followed by injection with tamoxifen on 5 consecutive days. Then the mice were injected with DT or vehicle for 7 consecutive days. After 7 days, the control (R26-iDTR) and Postn-CreERT2; R26-iDTR mice were euthanized for subsequent analysis. (C) Real-time qPCR analysis of iDTR mRNA expression levels in the lung of Postn-CreERT2; R26-iDTR and control mice. n = 4–5. (D and E) Survival percentage (D) and body weight change (E) of Postn-CreERT2; R26-iDTR and control mice. n = 5. (F) (left) Representative images of H&E, Sirius Red, and Masson staining in the lung sections of Postn-CreERT2; R26-iDTR mice after Postn+ cell ablation. (right) Quantification of the Ashcroft score, Sirius red fibrosis and Masson fibrosis area. (Scale bar: 1 mm, top; 100 μm, bottom). n = 5. (G) Representative images of Postn and α-SMA expression and quantification of α-SMA+ and Postn+ area in the lung sections of Postn-CreERT2; R26-iDTR mice after Postn+ cells ablation. Scale bar:100 μm. n = 5. (H) Hydroxyproline content in the lung of ablated and control mice after BLM challenge. n = 5. (I) Real-time qPCR analysis of Acta2, Col1a1, Postn, Fn1, Col3a1, and Tgfb1 mRNA expression levels in the lungs of Postn-CreERT2; R26-iDTR mice after the Postn+ cells ablation. n = 5. Shown are mean values ± SEM. Statistical significance was determined by the Mann-Whitney U test. **P < 0.01.
Figure 3
Figure 3. PIEZO1+ cell tracing and functional characterization of PIEZO1 in myofibroblasts.
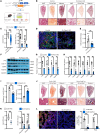
(A) Schematic representation showing the genetic strategy for the generation of the Piezo1-CreER; R26-GFP mice. (B) Schematic diagram of the experimental design. Piezo1-CreER; R26-GFP mice were injected with tamoxifen for 5 consecutive days followed by a single intratracheal inhalation of bleomycin (+BLM) or vehicle (–BLM). (C) Representative images of PIEZO1 expression in the Postn+ or α-SMA+ area before and after BLM challenge of Piezo1-CreER;R26-GFP mice, respectively. Scale bar: 20 μm. (D) Quantification of GFP+ in Postn+ or α-SMA+ cells. n = 6–7. (E) Representative images of PIEZO1 expression in the lung sections of patients with IPF. Scale bar: 20 μm. (F) Quantification of membrane tension before and after myofibroblast differentiation. n = 32. (G) Relative Piezo1 mRNA levels in myofibroblasts transfected with siCtrl or with siPiezo1. n = 6. (H) Representative cell-attached patch clamp traces of stretch-activated currents in myofibroblasts transfected with siCtrl or with siPiezo1. The holding potential was –70 mV and the membrane was stretched by pulses of negative pressure with a 10 mm Hg increment. (I) Statistical analysis of 4–5 independent recordings. (J) Representative cell-attached patch clamp traces of stretch-activated currents in myofibroblasts exposed to GdCl3 or PBS. The holding potential was –70 mV and the membrane was stretched by pulses of negative pressure with a 10 mm Hg increment. (K) Statistical analysis of 4 independent recordings. (L) Fluo-4–loaded myofibroblasts transfected with siCtrl or with siPiezo1 were exposed to 1 μM Yoda1, and [Ca2+]i was determined as fluorescence intensity (RFU, relative fluorescence units); line indicates the addition of Yoda1. Bar diagrams show the AUC of the Ca2+ transient. n = 18–45. Shown are mean values ± SEM. Statistical significance was determined by unpaired Student’s t test or the Mann-Whitney U test. **P < 0.01; ***P < 0.001.
Figure 4
Figure 4. Myofibroblast PIEZO1 promotes bleomycin-induced myofibroblast accumulation and lung fibrosis in mice.
(A) Schematic representation showing the genetic strategy for the generation of the Postn-CreERT2;Piezo1fl/fl mice (Pn-Piezo1-KO). And schematic diagram of the experimental design. (B) Representative images of H&E, Sirius Red, and Masson staining in the lung sections of Pn-Piezo1-KO and control (Piezo1fl/fl) mice after BLM challenge. (scale bar: 1 mm, top; 100 μm, bottom). (C) Quantification of the Ashcroft score, Sirius red, and Masson fibrosis area. n = 10–12. (D) Representative images of Postn and α-SMA expression in the lung sections of Pn-Piezo1KO and control mice after BLM challenge. Scale bar: 20 μm, n = 10–12. (E) Hydroxyproline content in the lung of Pn-Piezo1KO and control mice after BLM challenge. n = 7. (F and G) Western blot analysis (F) and quantification (G) of Fn1, Col1a1, Acta2, and Postn protein levels in lung homogenates of Pn-Piezo1KO and control mice at 21 d.p.i. n = 4. (H) Relative Acta2, Postn, Col1a1, Col3a1, Fn1, and Tgfb1 mRNA levels in the lung homogenates of Pn-Piezo1KO and control mice at 21 d.p.i. n = 5–7. (I) Lung resistance and dynamic compliance (Cdyn) analysis of Pn-Piezo1KO and control mice at 21 d.p.i. n = 4–7. (J) Representative images of H&E, Sirius Red, and Masson staining in the lung of C57BL/6J mice receiving BLM followed by GsMTx4 treatment. (Scale bar: 1 mm, top; 100 μm, bottom). (K) Quantification of the Ashcroft score, Sirius red fibrosis, and Masson fibrosis area. n = 8–10. (L) (left) Representative images of Postn and α-SMA expression in the lung sections of C57BL/6 mice receiving BLM followed by GsMTx4 treatment. Scale bar: 50 μm. (right) Quantification of α-SMA+ and Postn+ area in the lung of C57BL/6J mice receiving BLM followed by GsMTx4 treatment. n = 8. Shown are mean values ± SEM. Statistical significance was determined by unpaired Student’s t test or the Mann-Whitney U test. **P < 0.01; ***P < 0.001.
Figure 5
Figure 5. Myofibroblast Yap/Taz deletion ameliorate lung fibrosis.
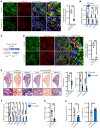
(A) Representative images (left) and quantification (right) of YAP/TAZ expression in the Postn+ cells in the lung sections of Pn-Piezo1-KO and control (Piezo1fl/fl) mice after BLM challenge. High magnification images show nuclear (arrowheads) and extranuclear (arrows) YAP/TAZ. Percentage of nuclear YAP/TAZ in GFP-positive cells was quantified. Scale bar: 20 μm. n = 6–8. (B) Real-time qPCR analysis of Lats2, Cyr61, and AmotL2 mRNA expression levels in the lung homogenates of Pn-Piezo1-KO and control mice at 21 d.p.i. n = 5–7. (C) Schematic representation showing the genetic strategy for the generation of the Postn-CreERT2;Yapfl/fl;Tazfl/fl mice (Pn-Yap/Taz-dKO). (D) Representative images (left) and quantification (right) of YAP/TAZ expression in the Postn+ cells in the lung sections of Pn-Yap/Taz-dKO and control (Yapfl/fl;Tazfl/fl) mice after BLM challenge. High magnification images show nuclear (arrowheads) and extranuclear (arrows) YAP/TAZ. Scale bar: 20 μm. n = 6–8. (E) (left) Representative images of H&E, Sirius Red, and Masson staining in the lung sections of Pn-Yap/Taz-dKO and control mice after BLM challenge. (Scale bar: 1 mm, top; 100 μm, bottom). (right) Quantification of the Ashcroft score, Sirius red fibrosis, and Masson fibrosis area. n = 8–13. (F) Real-time qPCR analysis of Acta2, Col1a1, Postn, Col3a1, Fn1, and Tgfb1 mRNA expression levels in the lung of Pn-Yap/Taz-dKO and control mice after BLM challenge. n = 6–10. (G) Hydroxyproline content in the lungs of Pn-Yap/Taz-dKO and control mice after BLM challenge. n = 7–9. (H) Lung resistance and Cdyn analysis of Pn-Yap/Taz-dKO and control mice at 21 d.p.i. n = 6–8. Shown are mean values ± SEM. Statistical significance was determined by unpaired Student’s t test or the Mann-Whitney U test. **P < 0.01; ***P < 0.001.
Figure 6
Figure 6. PIEZO1 and YAP/TAZ regulate myofibroblast proliferation and survival.
(A) Schematic representation showing the genetic strategy for generation of the Postn-CreERT2; Piezo1fl/fl; mT/mG mice (Pn-Piezo1-mT/mG). (BD) Representative images of Ki67 (B), P21 (C), and γ-H2A.X (D) expression in the GFP+ cells in the lung sections of Pn-Piezo1KO, mT/mG, and Pn-mT/mG mice after BLM challenge. Scale bar: 20 μm. (E) Quantification of Ki67+, P21+, and γ-H2A.X+ in Postn+ myofibroblasts in the lung sections of Pn-Piezo1KO, mT/mG, and Pn-mT/mG mice after BLM challenge. n = 6. The double-positive cells were defined by a GFP membrane around the Ki67, P21, or γ-H2A.X-positive nuclear. (FH) Representative images of Ki67 (F), P21 (G), and γ-H2A.X (H) expression in the GFP+ cells in the lung sections of Pn-Yap/Taz-dKO and control mice after BLM challenge. Scale bar: 20 μm. (I) Quantification of Ki67+, P21+, and γ-H2A.X+ in Postn+ myofibroblast in the lung sections of Pn-Yap/Taz-dKO and control mice after BLM challenge. n = 5–11. (J and K) Quantification of TUNEL+ myofibroblast percentage in the lung sections of Pn-Piezo1-KO, mT/mG (J, n = 14–17) and Pn-Yap/Taz-dKO (K, n = 17–28) mice after BLM challenge. Shown are mean values ± SEM. Statistical significance was determined by unpaired Student’s t test or the Mann-Whitney U test. **P < 0.01; ***P < 0.001.
Figure 7
Figure 7. Piezo1 loss impedes mechanical response in myofibroblasts.
(A) Schematic diagram of the experimental design for the myofibroblast stretch. NIH3T3 cells were differentiated to myofibroblasts by stimulation with 5 ng/mL Tgf-β1 for 72 hours. Then, myofibroblasts were subjected to 10% stretch for 12 hours at 1 Hz. (B and C) Representative images of cell morphological change and quantification of cell area and actin area change of myofibroblasts under cyclic stretch. Scale bar: 20 μm. n = 12–13. (D) Real-time qPCR analysis of actin mRNA expression levels in myofibroblasts under cyclic stretch. n = 8. (E) Real-time qPCR analysis of Acta2, Postn, Col1a1, Fn1, and Tgfb1 mRNA expression levels in myofibroblasts under cyclic stretch. n = 7–8. (FI) Representative images and quantification of YAP/TAZ (F), Ki67 (G), P21 (H), and γ-H2A.X (I) expression in myofibroblasts under cyclic stretch. Cells were costained with phalloidin. Scale bar: 20 μm. n = 7–11. (J) Quantification of TUNEL+ percentage in myofibroblasts under cyclic stretch. n = 10–11. (K) Real-time qPCR analysis of Lats2, Ctgf, and AmotL2 mRNA expression levels in myofibroblasts under cyclic stretch. n = 8. (L) Western blot analysis of the indicated protein levels under cyclic stretch. GAPDH was used as the internal control. Shown are mean values ± SEM. Statistical significance was determined by unpaired Student’s t test or the Mann-Whitney U test. **P < 0.01; ***P < 0.001.

References

    1. Richeldi L, et al. Idiopathic pulmonary fibrosis. Lancet. 2017;389(10082):1941–1952. doi: 10.1016/S0140-6736(17)30866-8. - DOI - PubMed
    1. Koudstaal T, et al. Pulmonary fibrosis: from pathogenesis to clinical decision-making. Trends Mol Med. 2023;29(12):1076–1087. doi: 10.1016/j.molmed.2023.08.010. - DOI - PubMed
    1. May J, et al. Beyond epithelial damage: vascular and endothelial contributions to idiopathic pulmonary fibrosis. J Clin Invest. 2023;133(18):e172058. doi: 10.1172/JCI172058. - DOI - PMC - PubMed
    1. Shenderov K, et al. Immune dysregulation as a driver of idiopathic pulmonary fibrosis. J Clin Invest. 2021;131(2):e143226. doi: 10.1172/JCI143226. - DOI - PMC - PubMed
    1. Moss BJ, et al. Pathogenic mechanisms underlying idiopathic pulmonary fibrosis. Annu Rev Pathol. 2022;17:515–546. doi: 10.1146/annurev-pathol-042320-030240. - DOI - PubMed

MeSH terms