. 2025 Jun 2;135(11):e187490.
doi: 10.1172/JCI187490.

PROX1 is an early driver of lineage plasticity in prostate cancer

Affiliations

PROX1 is an early driver of lineage plasticity in prostate cancer

Zhi Duan et al. J Clin Invest. .

Abstract

Lineage plasticity is recognized as a critical determinant of lethality and resistance to AR pathway inhibitors in prostate cancer. Lineage plasticity is a continuum, ranging from AR activity-low tumors, AR-null tumors that do not express a neuroendocrine prostate cancer (NEPC) program (i.e., double-negative prostate cancer [DNPC]), and AR-null NEPC tumors. Factors upregulated early in lineage plasticity are not well-characterized. The clarification of such factors is essential to identify tumors undergoing lineage plasticity or at risk of this occurring. Our integrative analysis of metastatic prostate cancer patient tumors, patient-derived xenografts, and cell models determined that PROX1 is upregulated early in the lineage plasticity continuum and progressively increases as tumors lose AR activity. We determined DNA methylation is a key regulator of PROX1 expression. PROX1 suppression in DNPC and NEPC reduces cell survival and impacts apoptosis and differentiation, demonstrating PROX1's functional importance. PROX1 is not directly targetable with standard drug development approaches. However, affinity immunopurification demonstrated histone deacetylases (HDACs) are among the top PROX1-interacting proteins; HDAC inhibition depletes PROX1 and recapitulates PROX1 suppression in DNPC and NEPC. Altogether, our results suggest PROX1 promotes the emergence of lineage plasticity, and HDAC inhibition is a promising approach to treat tumors across the lineage plasticity continuum.

Keywords: Cell biology; Epigenetics; Oncology; Prostate cancer.


Figures

Figure 1
Figure 1. PROX1 is upregulated in patient samples exhibiting AR pathway loss and lineage plasticity.
(A) Differentially upregulated genes ranked by adjusted P (Padj) value in prostate cancer patient tumors that converted to DNPC after enzalutamide treatment are shown from the Westbrook et al. 2022 cohort (6). PROX1 is the top-ranked gene. (BD) PROX1 mRNA levels were quantified by RNA-Seq in the indicated molecular subtypes of prostate cancer patient tumors from 3 different cohorts: Labrecque et al. 2019 (n = 98) (9) (B), WCDT (n = 210) (8, 22) (C), and Beltran et al. 2016 (n = 49) (7) (D). Molecular subtypes ARPC (AR+NE), amphicrine (AR+NE+), AR activity–low (ARlowNE), DNPC (ARNE), and NEPC (ARNE+) are indicated with the sample sizes of each group. Data are reported as the mean ± SD. P values were calculated by unpaired 2-sample Wilcoxon’s test with Benjamini-Hochberg correction for multiple comparison (B and C) and unpaired 2-sample Wilcoxon’s test (D). *P < 0.05; ***P < 0.001; ****P < 0.0001. (E and F) Kaplan-Meier curves represent overall survival probability for patients in the WCDT (8, 22) (E) or Abida et al. 2019 (23) (F) cohort stratified by quantiles of PROX1 expression. Q1 represents the lowest-quartile group, and Q4 represents the highest-quartile group. The log-rank test was used to determine significance.
Figure 2
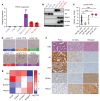
Figure 2. PROX1 is upregulated in patient-derived cell lines and xenografts exhibiting AR pathway loss and lineage plasticity.
(A and B) PROX1 mRNA expression was measured in the indicated prostate cancer models using reverse transcriptase quantitative PCR (RT-qPCR). β-Actin served as endogenous housekeeping control. Data are reported as the mean ± SD (n = 3) (A). PROX1 protein expression was measured in the indicated prostate cancer models using Western blotting. AR and PSA served as markers of ARPC. INSM1 served as marker for NEPC. β-Actin served as loading control (B). ARPC models are marked in blue, DNPC model in purple, and NEPC models in red text. (C) PROX1 mRNA levels were quantified by RNA-Seq in prostate cancer patient-derived xenografts (PDXs) (n = 114) of the indicated molecular subtypes with their sample sizes (GEO series GSE199596). Data are reported as the mean ± SD. Statistical significance was calculated by unpaired 2-sample Wilcoxon’s test with Benjamini-Hochberg correction for multiple comparison. *P < 0.05; ****P < 0.0001. (D) PROX1 expression in prostate cancer PDXs was determined by IHC, and representative images with their molecular subtype are shown. Scale bars: 100 μm. (E) Expression levels of indicated mRNAs were quantified by RNA-Seq in LTL331 PDXs at different time points during progression from LTL331 (PreCx) to LTL331R (Relapsed). Log2 transcripts per million (TPM) values are indicated in the heatmap. (F) LTL331 progression model tumors were stained by IHC with indicated antibodies before castration (PreCx/LT331), 12 weeks after castration (Cx12wks), or after relapse (Relapsed/LT331R), and representative images are shown. Scale bar: 100 μm.
Figure 3
Figure 3. PROX1 is epigenetically regulated by DNA methylation.
(A) PROX1 promoter methylation in prostate cancer patient tumors was extracted from the Zhao et al. 2020 dataset (n = 100) (26), and 5-methylcytosine (5-mC) score is shown. Data are reported as the mean ± SD. PROX1 promoter is significantly hypermethylated in NEPC (ARNE+) tumors as indicated by P values calculated by unpaired 2-sample Wilcoxon’s test with Benjamini-Hochberg correction for multiple comparison. **P < 0.01. (B) Scatterplots and linear fitted lines of PROX1 promoter DNA methylation versus log2 PROX1 expression in samples from the WCDT dataset (22, 26). Spearman’s correlation coefficient (ρ) and P values are shown. (C) Genome tracks from whole-genome bisulfite sequencing analysis of indicated PDX samples indicate hypermethylation of PROX1 promoter region (highlighted in yellow) in adenocarcinoma PDXs (blue) and hypomethylation in NEPC PDXs (red). (D) Methylation-specific PCR (MSPCR) was used to amplify a region of the PROX1 promoter from prostate cancer PDXs and cell models. Methylated (M) and unmethylated (U) specific bands are shown for the indicated samples, which are color-coded: ARPC by blue, amphicrine by orange, AR activity–low by green, DNPC by purple, and NEPC by red. (E) The indicated cell lines were treated with 400 nM dAza (decitabine) daily for 5 days. RT-qPCR was performed to quantify PROX1 expression with β-actin used as an endogenous control. Data are reported as the mean ± SD (n = 3). Statistical significance was calculated with a Student’s t test with Welch’s correction. *P < 0.05. (F) MSPCR was performed using DNA extracted from cells treated in E. Ratio of unmethylated (U) to methylated (M) products from densitometry analysis is shown below the respective bands.
Figure 4
Figure 4. PROX1 is inversely correlated with the AR and is upregulated in progenitor-like DNPC and NEPC tumor clusters.
(AC) Scatterplots and linear fitted lines of log2 TPM expression of AR versus PROX1 in the indicated molecular subtypes of prostate cancer samples from Labrecque et al. 2019 (n = 98) (9) (A), WCDT (n = 210) (8, 22) (B), and Beltran et al. 2016 (n = 49) (7) datasets (C). Pearson’s correlation coefficient (R) and P values are shown. (D) Feature plots of PROX1, INSM1, AR, and KLK3 expression extracted from scRNA-Seq meta-atlas published in Cheng et al. 2024 (31). Populations of NEPC (green ovals), KRT7+ DNPC (purple ovals), and progenitor-like DNPC (blue circles) are marked according to the original publication. (E) Violin plot showing the expression level of PROX1 across different cell populations in the scRNA-Seq meta-atlas of human prostate cancer published in Cheng et al. 2024 (31). PROX1 is only highly expressed in NEPC and progenitor-like DNPC populations. (F) Expression levels of indicated proteins were measured by Western blots in V16D and LNCaP cells transfected with empty vector (EV) or PROX1 overexpression vector after 72 hours. LASCPC-01 serves as a positive control for PROX1 and INSM1. β-Actin served as loading control.
Figure 5
Figure 5. PROX1 promotes differentiation and survival of NEPC models.
(A) PROX1 knockdown with 2 different doxycycline-inducible (Dox-inducible) shRNAs versus non-targeted control (NC) shRNA was performed in NCI-H660 and LASCPC-01 cells. Cell viability was measured by CCK-8 assays at the indicated time points. Data are reported as the mean ± SD (n = 6 for NCI-H660, n = 4 for LASCPC-01). PROX1 knockdown efficiency for each shRNA was confirmed by Western blotting. β-Actin served as loading control. For statistical analysis, shNC +Dox was compared with each shRNA +Dox by Student’s t test with Welch’s correction. ****P < 0.0001. (B) Apoptosis and EdU assays were performed using cells with Dox (1 μg/mL) treatment for 8 days. Data are reported as the mean ± SD (n = 3). For statistical analysis, 1-way ANOVA with Dunnett’s multiple-comparison test was performed. *P < 0.05; **P < 0.01; ****P < 0.0001. (C) RT-qPCR was used to measure expression of the indicated NEPC markers (CHGA and SYP) or PROX1 in NCI-H660 cells. β-Actin served as housekeeping control. Data are reported as the mean ± SD (n = 3). For statistical analysis, unpaired t test with Holm-Šidák method for multiple comparison was performed. **P < 0.01; ****P < 0.0001. (D) Western blots were used to measure expression of the indicated NEPC markers (CHGA and SYP) or PROX1 in NCI-H660 cells. β-Actin served as loading control. (E) Gene set enrichment analysis was performed on RNA-Seq samples (n = 2) from Dox-inducible shPROX1 or shNC NCI-H660 cells harvested after 8 days of Dox (1 μg/mL) induction.
Figure 6
Figure 6. HDAC inhibition blocks PROX1 expression and growth of NEPC and DNPC models.
(A) A PROX1 antibody was used to pull down PROX1 in LASCPC-01 cells, NCI-H660 cells, and an LTL331R PDX tumor. IgG was used as a negative control. Western blots were used to measure the indicated proteins. Input samples were included as endogenous control. (B) The indicated cell lines were treated with fimepinostat (left) and romidepsin (right), and cell viability was measured by CellTiter-Glo assays. IC50 values are shown. Data are reported as the mean ± SD (n = 4). (C) The indicated cell lines were treated with 5 nM fimepinostat, 2 nM romidepsin, or 500 nM entinostat for 48 hours. The indicated proteins were measured by Western blot. Histone H3 serves as loading control. (D) Overlapping pathways that change with PROX1 knockdown from Figure 5E or treatment with the HDAC inhibitor fimepinostat (Fime) or romidepsin (Romi) in NCI-H660 cells using RNA-Seq data from Zhang et al. 2023 (34) are presented as a bubble plot. (E) NSG mice were implanted with DNPC BCaP-1 PDXs and treated with vehicle, fimepinostat (75 mg/kg orally, 5 times per week), or romidepsin (1.5 mg/kg intraperitoneally, 2 times per week). Tumor volume (top) and mouse body weight (bottom) are shown. Data are reported as the mean ± SEM (n = 9 for vehicle and romidepsin, n = 6 for fimepinostat). Statistical significance was calculated using 2-way ANOVA with Dunnett’s multiple-comparison test. *P < 0.05. (F) Left: Protein was extracted from 4 endpoint PDX tumors from vehicle-, fimepinostat-, or romidepsin-treated mice and probed with the indicated antibodies by Western blot. Right: Quantification of PROX1 protein from the Western blot is presented as a bar plot. Data are reported as the mean ± SEM (n = 4). Statistical significance was calculated by 1-way ANOVA with Dunnett’s multiple-comparison test. **P < 0.01.

References

    1. Siegel RL, et al. Cancer statistics, 2025. CA Cancer J Clin. 2025;75(1):10–45. doi: 10.3322/caac.21871. - DOI - PMC - PubMed
    1. Hussain M, et al. Metastatic hormone-sensitive prostate cancer and combination treatment outcomes: a review. JAMA Oncol. 2024;10(6):807–820. doi: 10.1001/jamaoncol.2024.0591. - DOI - PubMed
    1. Bluemn EG, et al. Androgen receptor pathway-independent prostate cancer is sustained through FGF signaling. Cancer Cell. 2017;32(4):474–489. doi: 10.1016/j.ccell.2017.09.003. - DOI - PMC - PubMed
    1. Aggarwal R, et al. Clinical and genomic characterization of treatment-emergent small-cell neuroendocrine prostate cancer: a multi-institutional prospective study. J Clin Oncol. 2018;36(24):2492–2503. doi: 10.1200/JCO.2017.77.6880. - DOI - PMC - PubMed
    1. Beltran H, et al. The role of lineage plasticity in prostate cancer therapy resistance. Clin Cancer Res. 2019;25(23):6916–6924. doi: 10.1158/1078-0432.CCR-19-1423. - DOI - PMC - PubMed

Substances