. 2025 Jun 2:13:RP100923.
doi: 10.7554/eLife.100923.

Ferroptosis-related genes mediate tumor microenvironment and prognosis in triple-negative breast cancer via integrated RNA-seq analysis

Affiliations

Ferroptosis-related genes mediate tumor microenvironment and prognosis in triple-negative breast cancer via integrated RNA-seq analysis

Xuantong Gong et al. Elife. .

Abstract

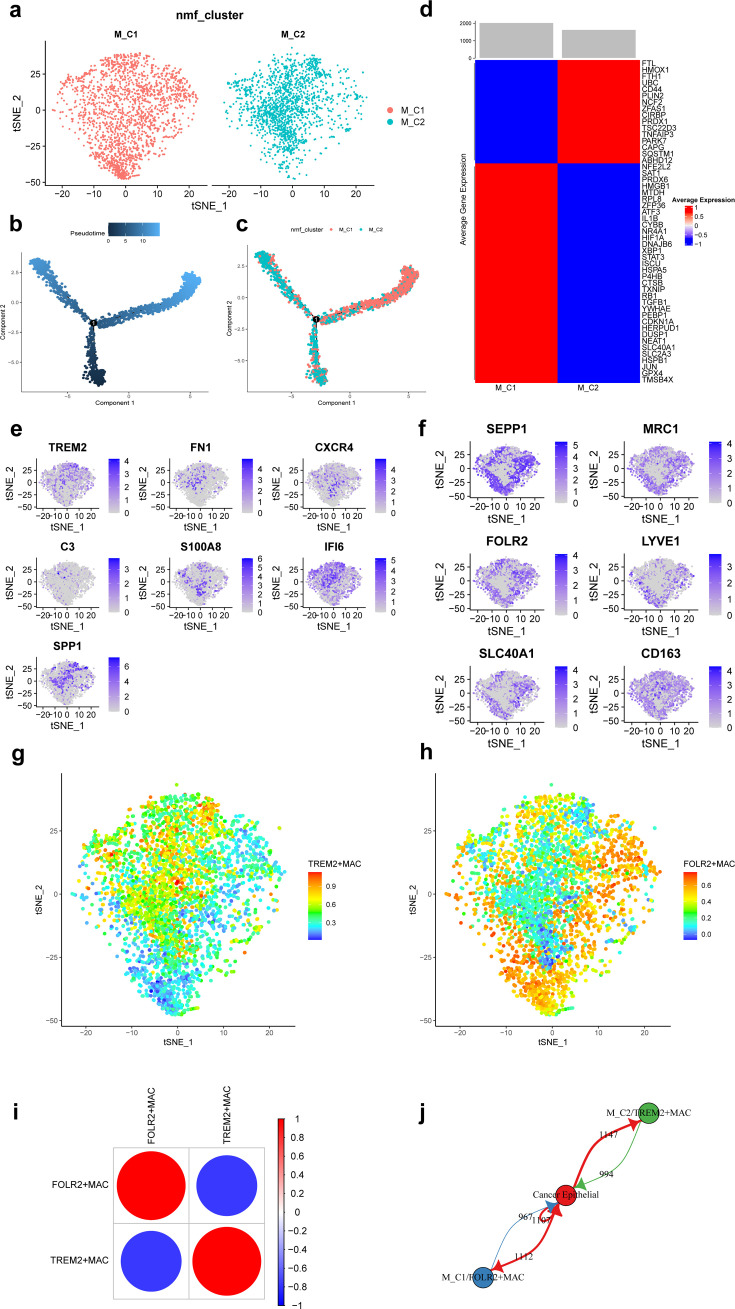
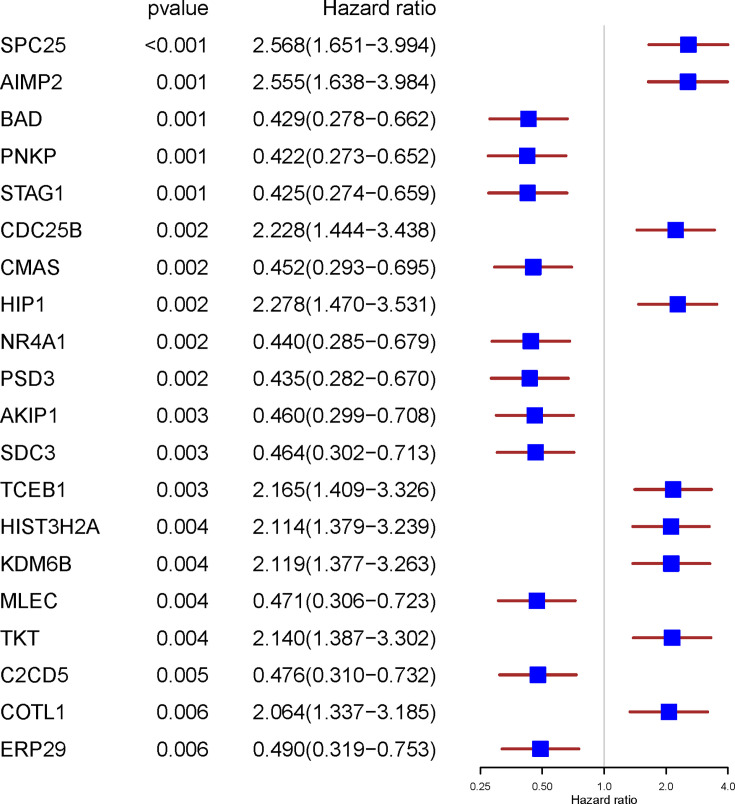
Triple-negative breast cancer (TNBC), an aggressive malignancy with limited tools to predict recurrence and drug sensitivity, exhibits ferroptotic heterogeneity across subtypes. However, the tumor microenvironment (TME) mediated by ferroptosis-related genes remains poorly characterized. This study integrates single-cell and bulk RNA sequencing data from the Gene Expression Omnibus to elucidate ferroptosis-driven TME features in TNBC, employing machine learning to develop prognostic and therapeutic response prediction models. At the single-cell level, T cells were classified into three subpopulations and macrophages into two subpopulations, with their infiltration degrees significantly correlated with clinical outcomes. A risk score model constructed based on these findings demonstrated robust predictive performance, validated in external cohorts with 3-, 4-, and 5-year area under the receiver operating characteristic curves of 0.65, 0.67, and 0.71, respectively. Notably, high-risk patients exhibited enhanced sensitivity to 27 therapeutic agents. By delineating ferroptosis-associated immune heterogeneity, this work provides a risk stratification tool to enhance prognostic precision and therapeutic decision-making in TNBC, while identifying genes offer actionable targets for TNBC precision medicine.

Keywords: RNA-seq; cancer biology; ferroptosis; none; triple-negative breast cancer; tumor microenvironment.


Conflict of interest statement

XG, LG, DY, YH, QL, HQ, YW No competing interests declared

Figures

Figure 1.
Figure 1.. Integration and clustering of scRNA-seq data from triple-negative breast cancer.
(a) t-SNE plot of the nine major cell clusters. (b) t-SNE plot of the 29 minor cell clusters. (c) t-SNE plot of the 12 major cell clusters. (d) The number of ligand–receptor interactions of different major cell clusters in cellcell communication network, different colors represent different cell clusters, and arrows represent ligandreceptor orientation. (e) Heat map showing the average expression of ferroptosis-related genes in different clinicopathological classifications. (f) Heat map showing the average expression of ferroptosis-related genes in different major cell clusters.
Figure 1—figure supplement 1.
Figure 1—figure supplement 1.. Single-cell RNA-seq data preprocessing in triple-negative breast cancer.
(a) Correlation analysis between the number of genes detected per cell and the total RNA molecule count, as well as the proportion of mitochondrial gene expression. (b) Violin plots visualizing statistical distributions of gene counts, total RNA molecule counts, mitochondrial gene proportion, and hemoglobin gene proportion across triple-negative breast cancer samples. (c) t-SNE plot of samples after batch effect correction.
Figure 2.
Figure 2.. Ferroptosis-related subpopulations of T cells in triple-negative breast cancer.
(a) t-SNE plot of the five identified clusters of T cells. (b) Heat map showing the expression of ferroptosis-related genes (top 50) in three subpopulations of T cells. (c) Demonstration of the proportion of clusters of T cells in ferroptosis-related subpopulations. (d) Pseudotime trajectories showing the developmental time course of T cells. (e) Pseudotime trajectories of the five identified clusters of T cells. (f) Pseudotime trajectories of ferroptosis-related subpopulations of T cells. (g) Heat map showing the average expression of signature genes associated with 8 functions in 15 subpopulations of T-cells. (h) Network diagram of the cell–cell communication between cancer epithelial cells and T cells. (i) Heat map for differential analysis of transcription factors activity.
Figure 3.
Figure 3.. Ferroptosis-related subpopulations of macrophages in triple-negative breast cancer.
(a) t-SNE plot of two ferroptosis-related subpopulations of macrophages. (b) Pseudotime trajectories showing the developmental time course of macrophages. (c) Pseudotime trajectories of two ferroptosis-related subpopulations of macrophages. (d) Heat map showing the average expression of ferroptosis-related genes in two subpopulations of macrophages. (e) t-SNE plot showing the expression patterns of marker genes in M_C2. (f) t-SNE plot showing the expression patterns of marker genes in M_C1. (g) t-SNE plot showing the enrichment score of the TREM2 + MAC in each cell. (h) t-SNE plot showing the enrichment score of the FOLR2 + MAC in each cell. (i) Bubble plot showing the correlation of enrichment score between TREM2 + MAC and FOLR2 + MAC. (j) Network diagram of the cell-cell communication between cancer epithelial cells and ferroptosis-related subpopulations of macrophages.
Figure 3—figure supplement 1.
Figure 3—figure supplement 1.. Heat map for differential analysis of transcription factors activity among different subpopulations of macrophages in the triple-negative breast cancer.
Figure 4.
Figure 4.. Prognostic differences in triple-negative breast cancer with ferroptosis-related subpopulations.
(a) Least Absolute Shrinkage and Selection Operator (LASSO) regression of 23 ferroptosis-related genes. (b) Cross-validation for optimizing the parameter in LASSO regression. (c) Demonstration of regression coefficients corresponding to 23 genes. (d) Graph showing risk scores for all samples. (e) Scatterplot showing recurrence-free survival for all samples. (f) Heat map showing the average expression of 23 genes in the low- and high-risk groups. (g) Kaplan–Meier curves of survival analysis in the low- and high-risk groups. (h) Receiver operating characteristic curves for predicting the recurrence-free survival at 3, 4, and 5 years in training set. (i) Receiver operating characteristic curves for predicting the recurrence-free survival at 3, 4 and 5 years in external validation set.
Figure 4—figure supplement 1.
Figure 4—figure supplement 1.. The forest plot of the top 20 ferroptosis-related genes significantly associated with disease-free survival based on univariate Cox regression analysis (p0.01).
Figure 5.
Figure 5.. Analysis of independent prognostic factors for triple-negative breast cancer patients.
(a) The forest plot showing the results of univariate and multivariate COX regression analysis of risk score, age, grade, and stage in the GSE25066 database. (b) The forest plot showing the results of univariate and multivariate COX regression analysis of risk score, grade, and stage in the GSE86166 database.
Figure 6.
Figure 6.. Analysis of immune microenvironment in low- and high-risk groups.
(a–d) Correlation of the risk score with the ImmuneScore, StromalScore, ESTIMATEScore, and TumorPurity. (e) Difference of ImmuneScore, StromalScore, and ESTIMATEScore in low- and high-risk groups. (f) Difference of TumorPurity in low- and high-risk groups. (g) Difference of immune infiltration score between low- and high-risk groups calculated by CIBERSORT. *p<0.05, **p<0.01, ns: p>0.05.
Figure 7.
Figure 7.. Correlation analysis between risk score and drug sensitivity.
(a) Box plot showing differences of IC50 for drugs negatively associated with risk scores in different groups. (b) Box plot showing differences of IC50 for drugs positively associated with risk scores in different groups. (c) Box plot showing differences of TIDE scores in different groups. *p<0.05, **p<0.01, ***p<0.001, ****p<0.0001, ns: p>0.05.

Update of

  • doi: 10.1101/2024.07.04.602021
  • doi: 10.7554/eLife.100923.1
  • doi: 10.7554/eLife.100923.2

References

    1. Aibar S, González-Blas CB, Moerman T, Huynh-Thu VA, Imrichova H, Hulselmans G, Rambow F, Marine J-C, Geurts P, Aerts J, van den Oord J, Atak ZK, Wouters J, Aerts S. SCENIC: single-cell regulatory network inference and clustering. Nature Methods. 2017;14:1083–1086. doi: 10.1038/nmeth.4463. - DOI - PMC - PubMed
    1. Bardia A, Mayer IA, Vahdat LT, Tolaney SM, Isakoff SJ, Diamond JR, O’Shaughnessy J, Moroose RL, Santin AD, Abramson VG, Shah NC, Rugo HS, Goldenberg DM, Sweidan AM, Iannone R, Washkowitz S, Sharkey RM, Wegener WA, Kalinsky K. Sacituzumab govitecan-hziy in refractory metastatic triple-negative breast cancer. The New England Journal of Medicine. 2019;380:741–751. doi: 10.1056/NEJMoa1814213. - DOI - PubMed
    1. Bense RD, Sotiriou C, Piccart-Gebhart MJ, Haanen JBAG, van Vugt MATM, de Vries EGE, Schröder CP, Fehrmann RSN. Relevance of tumor-infiltrating immune cell composition and functionality for disease outcome in breast cancer. Journal of the National Cancer Institute. 2017;109:djw192. doi: 10.1093/jnci/djw192. - DOI - PMC - PubMed
    1. Binnewies M, Roberts EW, Kersten K, Chan V, Fearon DF, Merad M, Coussens LM, Gabrilovich DI, Ostrand-Rosenberg S, Hedrick CC, Vonderheide RH, Pittet MJ, Jain RK, Zou W, Howcroft TK, Woodhouse EC, Weinberg RA, Krummel MF. Understanding the tumor immune microenvironment (TIME) for effective therapy. Nature Medicine. 2018;24:541–550. doi: 10.1038/s41591-018-0014-x. - DOI - PMC - PubMed
    1. Boutros R, Lobjois V, Ducommun B. CDC25 phosphatases in cancer cells: key players? Good targets? Nature Reviews. Cancer. 2007;7:495–507. doi: 10.1038/nrc2169. - DOI - PubMed

Associated data

LinkOut - more resources