. 2025 Jun 17;482(12):839-857.
doi: 10.1042/BCJ20253130.

A new naphthalene-based fluorogenic substrate for cytochrome P450 4A11

Affiliations

A new naphthalene-based fluorogenic substrate for cytochrome P450 4A11

Dmitri R Davydov et al. Biochem J. .

Abstract

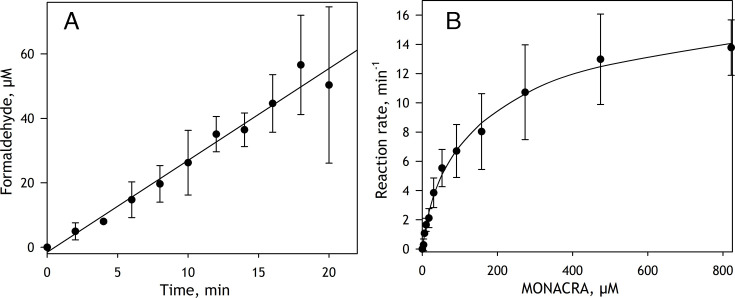
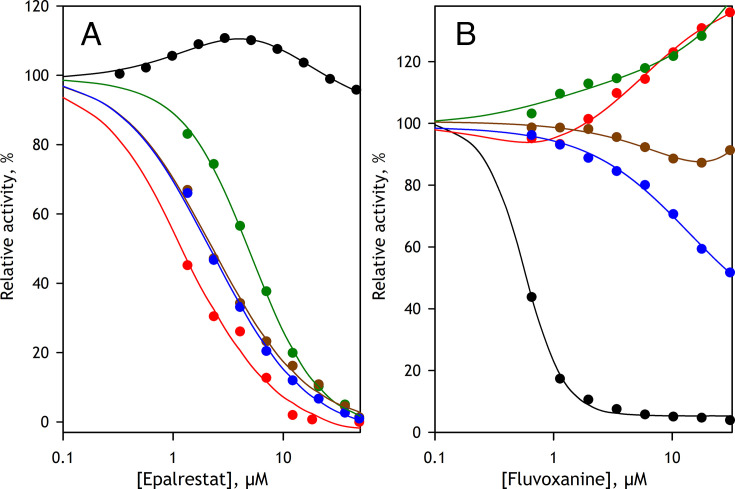
We aimed to create a high-throughput fluorimetric assay for the activity of CYP4A11, the major 20-HETE-producing enzyme. To this end, we probed 3-(6-methoxynaphthalen-2-yl)acrylic acid (MONACRA) as a potential CYP4A11 substrate. We studied its metabolism using human liver microsomes (HLM) and recombinant P450 enzymes. O-demethylation of MONACRA by cytochromes P450 creates 3-(6-hydroxynaphthalen-2-yl)acrylic acid. The bright fluorescence of the product and its clear spectral resolution from the substrate allowed us to create a fluorimetric assay of MONACRA metabolism. We tested 16 recombinant human P450 enzymes and found noticeable demethylation activity only with CYP4A11 and CYP1A2. The KM for CYP4A11 is 189±37 μM, and the kcat accounts for 67±18 min-1. CYP1A2 exhibits a KM of 161±34 μM, with a kcat value of 44±6 min-1, although this enzyme also exhibited a decreased rate of turnover at high substrate concentrations, evidencing substrate inhibition with Ksi=650±200 μM. The studies with fluvoxamine and epalrestat, specific inhibitors of CYP1A2 and CYP4A11, respectively, showed that despite the activity of recombinant CYP1A2 with MONACRA, it does not take part in its metabolism in HLM. Thus, MONACRA can be utilized as a specific fluorogenic substrate of CYP4A11. We developed a robust and sensitive automated fluorimetric assay of MONACRA demethylation and used it to compare the substrate saturation profiles in seven pooled HLM preparations with the known composition of the P450 pool. These studies demonstrated a close correlation between the rate of the main kinetic phase of MONACRA metabolism and the fractional content of CYP4A11 in the P450 pool.

Keywords: 3-(6-methoxynaphthalen-2-yl)acrylic acid; CYP1A2; CYP4A11; fluorogenic substrates; high-throughput activity assay; human liver microsomes.


Conflict of interest statement

The authors declare no competing of interest.

Figures

Figure 1:
Figure 1:. Structures of luciferin 4A (left) and 3-(6-methoxynaphthalen-2-yl)acrylic acid (MONACRA, right).
Figure 2:
Figure 2:. Docking of arachidonic acid (purple) and 3-(6-methoxynaphthalen-2-yl)acrylic acid (MONACRA; tan) molecules into the substrate binding pocket of CYP4A11.: The structural model of CYP4A11 was generated by AlphaFold and the porphyrin moiety (orange) covalently connected to the Glu321 side chain (gray) was inserted by superimposing the AlphaFold-generated structure of the protein chain with the crystal structure of CYP4B1 (PDB entry 5T6Q). This image was produced using the Chimera 1.18 package from the Computer Graphics Laboratory, University of California, San Francisco (http://www.cgl.ucsf.edu/chimera/, [33])
Figure 3:
Figure 3:. O-demethylation of 3-(6-methoxynaphthalen-2-yl)acrylic acid (MONACRA) by monkey liver microsomes (MLM).
Panel A shows a kinetic trace of the accumulation of formaldehyde formed upon incubation of 2.5 mg/ml MLM (~0.3 µM of microsomal CPR) with 300 µM MONACRA in the presence of NADPH-generating system. Panel B exemplifies the substrate saturation profile of MONACRA demethylation by MLM (0.98 mg/ml) determined by formed formaldehyde with acetoacetanylide (FA-AAA) assay with 20-min incubation at 30°C. The datasets shown in the figures represent averages of the results of two individual experiments, and the error bars indicate the standard deviations.
Figure 4:
Figure 4:. Kinetics of O-demethylation of 3-(6-methoxynaphthalen-2-yl)acrylic acid (MONACRA) studied by LC-MS.
Panel A shows the plots of time-dependent changes of MONACRA (circles), hydroxy-naphthyl acrylic acid (HONACRA; triangles), and formaldehyde-derived 3,5-di-N-phenylacetyl-1,4-dihydrolutidine (DPDL) (squares) upon incubation of 0.125 µM CYP1A2 Supersomes with 75 µM MONACRA and NADPH-generating system at 36°C. The datasets represent the averages of the results of two individual experiments, and the error bars indicate the standard deviations. Panel B exemplifies the same plots obtained in the experiment with 0.075 µM CYP4A11 Supersomes and 78.8 µM MONACRA. The datasets for MONACRA and HONACRA shown in this figure are the averages of the results of two independent experiments. The formaldehyde accumulation dataset represents an average of the results of LC-MS and fluorimetric determinations of DPDL in the same experiment.
Figure 5:
Figure 5:. Changes in the spectra of excitation (A) and emission (B) of 3-(6-methoxynaphthalen-2-yl)acrylic acid (MONACRA) fluorescence caused by its O-demethylation.
The spectra were recorded in 30-sec intervals during incubation of 1.7 mg/ml MLM with 200 µM MONACRA in 0.1 M Na-Hepes buffer, pH 7.4, containing 60 mM KCl and NADPH-generating system at 36°C. The main panels of the graphs exemplify the spectra recorded after 0 (brown), 10, 20, 30, 40, and 50 (purple) min of incubation. The insets show the results of applying principal component analysis (PCA) to these spectral series. The top insets show the spectra of the first principal component (>99.5% of the overall spectral changes), whereas the time dependencies of the respective eigenvalues are shown in the bottom insets. Spectra of excitation were recorded at the emission wavelength of 440 nm, whereas the emission spectra correspond to excitation at 350 nm. The slits of the excitation and emission monochromators were set to 5 nm bandwidth, and the voltage at the PMT was set to 600 V.
Figure 6:
Figure 6:. Spectra of excitation (dashed lines) and emission (solid lines) of 3-(6-methoxynaphthalen-2-yl)acrylic acid (MONACRA; black) and hydroxy-naphthyl acrylic acid (HONACRA; red).
The spectra correspond to the fluorescence of 1 µM substances in Hepes buffer, pH 7.4, measured with a Cary Eclipse spectrofluorometer in a 5 × 5 quartz cell at PMT voltage of 600 V and excitation and emission slits set to 5 nm bandwidth. The spectra of excitation were recorded at the emission wavelength of 440 nm. The spectra of emission correspond to excitation at 350 nm.
Figure 7:
Figure 7:. The time course of 3-(6-methoxynaphthalen-2-yl)acrylic acid (MONACRA) demethylation by monkey liver microsomes (MLM) monitored by spectra of fluorescence at pH 10.4.
The emission spectra (excitation at 375 nm) shown in panel A represent the samples quenched in 2-min intervals after starting the reaction by adding MLM, where the spectra shown in black and red correspond to the time points of 0 and 16 min, respectively. The reaction mixture containing 400 µM MONACRA, 60 mM KCl, 1.7 mg/ml MLM, and NADPH-generating system in 0.1 M Na-Hepes buffer, pH 7.4, was incubated at 36° in a multiwell plate placed in a shaking incubator. The inset in panel A shows the spectrum of the first principal component (99.3% of the overall spectral changes) obtained by applying PCA to this spectral series. Panel B shows the time dependence of the respective eigenvalues (open circles) along with the time course of the increase in formaldehyde concentration determined by FA-AAA assay (closed circles).
Figure 8:
Figure 8:. Spectra of fluorescence of 3-(6-methoxynaphthalen-2-yl)acrylic acid (MONACRA; black) and hydroxy-naphthyl acrylic acid (HONACRA; red) at pH 10.4.
The plots in thin dashed and solid lines represent the spectra of excitation and emission, respectively, whose amplitudes correspond to emission and excitation at the respective maximum. The plots shown in bold dashed-and-dotted lines correspond to the spectra of emission of MONACRA and HONACRA recorded with excitation at 375 nm.
Figure 9:
Figure 9:. Substrate saturation profiles (SSPs) of 3-(6-methoxynaphthalen-2-yl)acrylic acid (MONACRA) metabolism by CYP4A11 (triangles), CYP1A2 (circles), and CYP2C8 (squares) in Supersomes.
The reaction rate is expressed as mol of product per mol of P450 per minute (min−1). The datasets shown in the graph represent the averages of the results of 5 (CYP4A11), 6 (CYP1A2) or 4 (CYP2C8) individual experiments. The solid lines represent the results of fitting the datasets to the Michaelis–Menten equation (CYP4A11 and CYP2C8) or the equation of substrate inhibition (CYP1A2).
Figure 10:
Figure 10:. Substrate saturation profiles (SSPs) of 3-(6-methoxynaphthalen-2-yl)acrylic acid (MONACRA) metabolism by seven pooled preparations of human liver microsomes (HLMs) and their global analysis.
The HLM preparations used in this study and their designations are described in the “Materials and Methods” section of the article. Panel (A) shows the SSPs obtained with HLM preparations CDN (brown), DNJ (orange), EGW (red), WGP (green), X096 (light blue), X263 (dark blue), and X347 (purple) along with their approximations (solid lines) obtained from global fitting of the dataset with a combination of three Michaelis–Menten equations. Panel (B) shows the plots of the first (black) and the second (red) principal components found by PCA applied to the shown dataset. These two principal components cover 99.4% of the overall differences between the SSPs. Panel (C) shows three Michaelis–Menten components obtained from the global fitting of the dataset and used to approximate the traces shown in panels A and B.
Figure 11:
Figure 11:. Correlations between the amplitude of the middle-affinity phase and relative abundance of CYP4A11 (A) and between the amplitude of the high-affinity phase and relative abundance of cytochrome b 5 (B).
Figure 12:
Figure 12:. Effect of epalrestat (A) and fluvoxamine (B) on 3-(6-methoxynaphthalen-2-yl)acrylic acid (MONACRA) demethylation by recombinant CYP1A2 (black) and CYP4A11 (red) and three pooled human liver microsome (HLM) preparations: X263 (green), DNJ (blue), and WGP (brown).
Solid lines represent the approximation of the datasets by eqn 1 (in the instances of pure inhibition) or a combination of two hyperbolic equations (in the cases of activation or combined inhibition and activation). All experiments were carried out at 150 µM MONACRA concentration. The datasets shown in the graphs represent the averages of the results of four (fluvoxamine) or two (epalrestat) individual experiments.

Similar articles

References

    1. Backes, W.L. and Kelley, R.W . (2003) Organization of multiple cytochrome P450s with NADPH-cytochrome P450 reductase in membranes. Pharmacol. Ther. 98, 221–233 10.1016/s0163-7258(03)00031-7 - DOI - PubMed
    1. Reed, J.R. and Backes, W.L . (2012) Formation of P450 · P450 complexes and their effect on P450 function. Pharmacol. Ther. 133, 299–310 10.1016/j.pharmthera.2011.11.009 - DOI - PMC - PubMed
    1. Davydov, D.R . (2011) Microsomal monooxygenase as a multienzyme system: the role of P450-P450 interactions. Expert Opin. Drug Metab. Toxicol. 7, 543–558 10.1517/17425255.2011.562194 - DOI - PMC - PubMed
    1. Guengerich, F.P . (2024) Roles of Individual Human Cytochrome P450 Enzymes in Drug Metabolism. Pharmacol. Rev. 76, 1104–1132 10.1124/pharmrev.124.001173 - DOI - PMC - PubMed
    1. Niwa, T. , Murayama, N. and Yamazaki, H . (2009) Oxidation of endobiotics mediated by xenobiotic-metabolizing forms of human cytochrome P450. Curr. Drug Metab. 10, 700–712 10.2174/138920009789895525 - DOI - PubMed

MeSH terms

LinkOut - more resources