. 2025 Jul 1;329(1):L161-L171.
doi: 10.1152/ajplung.00302.2024. Epub 2025 Jun 2.

Divergent ventilatory responses during opioid-induced respiratory depression in response to repeated fentanyl use

Affiliations

Divergent ventilatory responses during opioid-induced respiratory depression in response to repeated fentanyl use

Karan G Rai et al. Am J Physiol Lung Cell Mol Physiol. .

Abstract

Opioid-induced respiratory depression (OIRD) is the hallmark of opioid overdose and a major risk factor for death due to fentanyl use. Although repeat opioid use (ROU) elevates the risk of death, understanding its influence over breathing and its control has been poorly resolved. We developed a mouse model of recurrent fentanyl use over 5 days to examine how ROU impacts breathing and activity from the pre-Bötzinger complex (preBötC), the brainstem network driving inspiratory rhythmogenesis. Initial fentanyl use caused a profound metabolic crisis during OIRD involving a mismatch between ventilation and oxygen consumption. By day 5 of ROU, 77% of mice exhibited an adaptive ventilatory response following ROU, which was accompanied by an improved relationship between ventilation and oxygen consumption during OIRD. However, in the remaining minority, the adaptive response during OIRD failed to emerge following ROU. This divergence emphasizes the heterogeneity in ventilatory and metabolic outcomes following ROU. Moreover, following ROU, rhythmogenesis in the preBötzinger complex was less sensitive to mu-opioid receptor agonism, indicating that adaptation to ROU involves centrally mediated changes in this brainstem network. These findings reveal a series of physiological changes following ROU, typically resulting in improved ventilation and oxygenation during OIRD. Such changes, or lack of thereof, may contribute to the unpredictable nature of overdose susceptibility among opioid users.NEW & NOTEWORTHY Recurring fentanyl use is a significant factor contributing to opioid-related deaths, yet the physiological impact of repeat opioid use on breathing remains poorly understood. This study demonstrates that divergent ventilatory responses to opioids emerge following repeated fentanyl administration. These responses coincide with changes in oxygen consumption and inspiratory rhythmogenesis from the preBötzinger complex. These observations advance an understanding of the physiological basis for susceptibility and tolerance among individuals likely to succumb to opioid overdose.

Keywords: fentanyl; opioid use disorder; oxygen metabolism; preBötzinger complex; respiratory depression.


Conflict of interest statement

CONFLICT OF INTEREST: The authors declare no competing financial interests.

Figures

Figure 1.
Figure 1.
Breathing in response to repeated opioid use. (N=27) A. (Left) Representative breathing trace showing the occurrence of apneas on Day 1 and Day 5 prior to fentanyl administration (i.e., baseline air-breathing). Apneas (highlighted by pink boxes) are increased on Day 5. (Right) Linear regression of apnea index on Day 5 versus Day 1 (red line, m=2.65±0.32. Unity line (m = 1, dashed grey line) shown for comparison. Scale bars: 0.5 sec × 2mL. B. Representative breathing trace prior to fentanyl administration (Baseline, Day 1 and Day 5, grey) and during OIRD (Day 1 red, Day 5 blue). Scale bars: 0.5 sec × 2mL. C. Time course of Ve over time during OIRD Day 1 (red) and Day 5 (blue); D. Comparison of Ve during OIRD on Day 1 (red) and Day 5 (blue) of ROU.
Figure 2.
Figure 2.
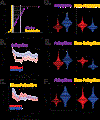
Examining individual Ve reveals divergent responses to ROU. A. The individual percentage change in Ve on Day 5 relative to Day 1 (N=27). Two breathing responses are evident: (1) the adaptive response (AVR; purple, N=21/27) where Ve during OIRD is larger to that on Day 1 vs. Day 5 of ROU; and (2) the non-adaptive response (NVR; yellow, N=6/27) where is Ve during OIRD is less than or equal to that on Day 1 vs. Day 5. Dashed vertical lines indicate the mean adaptive (mean=95.1%; purple) and mean non-adaptive (mean=−26.3%; yellow) change in Ve relative to Day 1. For reference, shaded grey box represents the standard deviation (± 2.75%) for the change in Ve saline-mice treated with (N=10) measured on Day 5 relative to Day 1. B. Time course of mean Ve during OIRD for adaptive (purple) and non-adaptive response (yellow) on Day 1. C. Time course of mean Ve during OIRD for adaptive (purple) and non-adaptive response (yellow) on Day 5. D. Comparison of mean Ve during OIRD on Day 1 (red) and Day 5 (blue) in adaptive (left) and non-adaptive (right) individuals. E. Comparison of mean RR during OIRD on Day 1 and Day 5 in adaptive (left) and non-adaptive (right) individuals. D. Comparison of mean VT during OIRD on Day 1 and Day 5 in adaptive (left) and non-adaptive (right) individuals. N.S.: Not significant (P>0.05).
Figure 3.
Figure 3.
Longitudinal tracking ventilatory metrics during OIRD in adaptive and non-adaptive subjects. A. Ve during OIRD over six days of fentanyl administration in AVR mice. B. RR during OIRD over six days of fentanyl administration in AVR mice. C. VT during OIRD over six days of fentanyl administration in AVR mice. D. MIF during OIRD over six days of fentanyl administration in AVR mice. (N=7/11) E. Ve during OIRD over six days of fentanyl administration in mice showing the non-adaptive response to ROU by Day 5. F. RR during OIRD over six days of fentanyl administration in mice showing the non-adaptive response to ROU by Day 5. G. VT,during OIRD over six days of fentanyl administration in mice showing the non-adaptive response to ROU by Day 5. H. MIF during OIRD over six days of fentanyl administration in mice showing the non-adaptive response to ROU by Day 5. (N=4/11) Values are reported as mean ± S.E.M. A one-way repeated measure ANOVA was performed for each ventilatory metric followed by a post hoc Dunnett Test. Statistics were provided when the P<0.05 for the one-way repeated ANOVA and the for the comparison in the Dunnett Test was P<0.05 are reported in the figure. See Appendix Table 1. for a complete description of statistics.
Figure 4.
Figure 4.
Development of apneas following ROU. A. (Left) Representative breathing traces during quiet room-air breathing on Day 1 and Day 5 from a mouse exhibiting the AVR following ROU. (Right) Comparison of the apnea index on Day 1 and Day 5 of ROU in AVR mice (N = 21/27). B. (Left) Representative breathing traces during quiet room-air breathing on Day 1 and Day 5 from a mouse exhibiting the NVR following ROU. (Right) Comparison of the apnea index on Day 1 and Day 5 of ROU in NVR mice (N = 6/27). Pink boxes highlight apneas. Scale bars: 0.5 sec × 2mL.
Figure 5.
Figure 5.
O2 consumption (VO2) and its relationship to breathing changes following ROU. A. VO2 during OIRD on Day 1 and Day 5 expressed as a percentage of baseline (N=16). While baseline absolute VO2 was similar between Day 1 and Day 5 (P=0.61, data not shown), absolute VO2 during OIRD was greater on Day 5 (P=0.046, data not shown). B. Comparison of the baseline Ve to VO2 relationship on Day 1 (grey; Day 1: r2 = 0.371; m = 12.692 ± 4.421) and Day 5 (black; Day 5: r2 = 0.267; m = 8.011 ± 3.544) of ROU. C. Comparison of the Ve to VO2 relationship during OIRD on Day 1 (red; Day 1: r2 = 0.002; m = −0.371 ± 2.090) and Day 5 (blue; Day 5: r2 = 0.202; m = ±) of ROU. D. Comparison of the baseline Ve to VO2 relationship during OIRD on Day 1 (red; Day 1: r2 = 0.215; m = −2.381 ± 1.373) and Day 5 (blue; Day 5: r2 = 0.112; m = 4.418 ± 3.754) in subjects showing the adaptive response to ROU (N = 13). E. Comparison of the baseline Ve to VO2 relationship during OIRD on Day 1 (red; Day 1: r2 = 0.721; m = 10.270 ± 6.387) and Day 5 (blue; Day 5: r2 = 0.995; m = 3.585 ± 0.246) in subjects showing the non-adaptive response to ROU (N=3).
Figure 6.
Figure 6.
The efficacy of opioid neuromodulation in the in vitro preBötC is reduced following ROU. A Representative integrated traces from preBötC recordings in response to increasing levels of DAMGO (0 to 1000 mM) in rhythmic slices from control mice (left, black) and mice that underwent ROU (right, red). B. Comparison of instantaneous frequency of rhythmogenesis in the preBötC between control and ROU. C. Comparison of fictive inspiratory drive in the preBötC between control and ROU. Fictive inspiratory drive was defined at the normalized Burst amplitude of the preBötC (nBA) divided by time to peak (in msec).

Similar articles

References

    1. Dahan A, et al. , Pharmacovigilance: a review of opioid-induced respiratory depression in chronic pain patients. Pain Physician, 2013. 16(2): p. E85–94. - PubMed
    1. Hoffman JR, Schriger DL, and Luo JS, The empiric use of naloxone in patients with altered mental status: a reappraisal. Ann Emerg Med, 1991. 20(3): p. 246–52. - PubMed
    1. Darke S and Zador D, Fatal heroin ‘overdose’: a review. Addiction, 1996. 91(12): p. 1765–72. - PubMed
    1. Montandon G, et al. , PreBotzinger complex neurokinin-1 receptor-expressing neurons mediate opioid-induced respiratory depression. J Neurosci, 2011. 31(4): p. 1292–301. - PMC - PubMed
    1. Montandon G and Horner R, CrossTalk proposal: The preBotzinger complex is essential for the respiratory depression following systemic administration of opioid analgesics. J Physiol, 2014. 592(6): p. 1159–62. - PMC - PubMed

MeSH terms

LinkOut - more resources