

Ground-truth-free deep learning approach for accelerated quantitative parameter mapping with memory efficient learning
- PMID: 40455714
- PMCID: PMC12129214
- DOI: 10.1371/journal.pone.0324496
Ground-truth-free deep learning approach for accelerated quantitative parameter mapping with memory efficient learning
Abstract
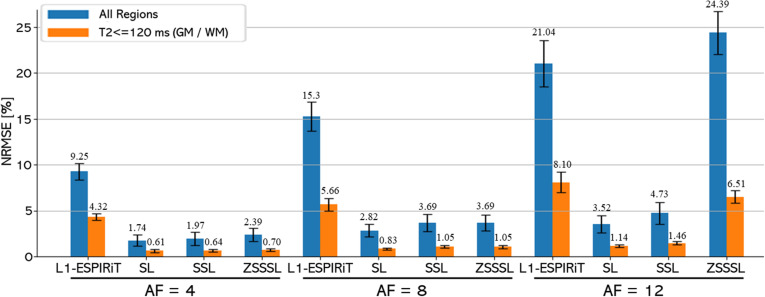
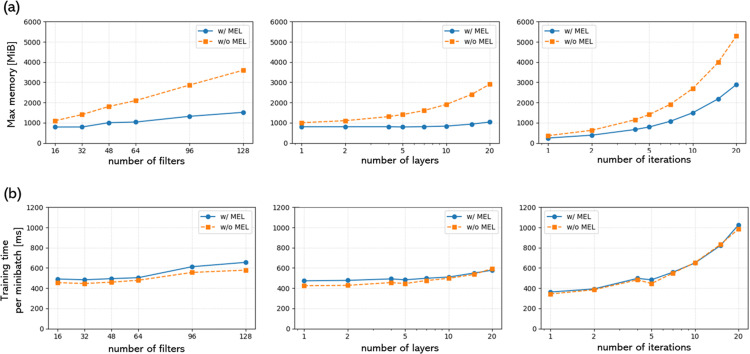
Quantitative MRI (qMRI) requires the acquisition of multiple images with parameter changes, resulting in longer measurement times than conventional imaging. Deep learning (DL) for image reconstruction has shown a significant reduction in acquisition time and improved image quality. In qMRI, where the image contrast varies between sequences, preparing large, fully-sampled (FS) datasets is challenging. Recently, methods that do not require FS data such as self-supervised learning (SSL) and zero-shot self-supervised learning (ZSSSL) have been proposed. Another challenge is the large GPU memory requirement for DL-based qMRI image reconstruction, owing to the simultaneous processing of multiple contrast images. In this context, Kellman et al. proposed memory-efficient learning (MEL) to save the GPU memory. This study evaluated SSL and ZSSSL frameworks with MEL to accelerate qMRI. Three experiments were conducted using the following sequences: 2D T2 mapping/MSME (Experiment 1), 3D T1 mapping/VFA-SPGR (Experiment 2), and 3D T2 mapping/DESS (Experiment 3). Each experiment used the undersampled k-space data under acceleration factors of 4, 8, and 12. The reconstructed maps were evaluated using quantitative metrics. In this study, we performed three qMRI reconstruction measurements and compared the performance of the SL- and GT-free learning methods, SSL and ZSSSL. Overall, the performances of SSL and ZSSSL were only slightly inferior to those of SL, even under high AF conditions. The quantitative errors in diagnostically important tissues (WM, GM, and meniscus) were small, demonstrating that SL and ZSSSL performed comparably. Additionally, by incorporating a GPU memory-saving implementation, we demonstrated that the network can operate on a GPU with a small memory (<8GB) with minimal speed reduction. This study demonstrates the effectiveness of memory-efficient GT-free learning methods using MEL to accelerate qMRI.
Copyright: © 2025 Fujita et al. This is an open access article distributed under the terms of the Creative Commons Attribution License, which permits unrestricted use, distribution, and reproduction in any medium, provided the original author and source are credited.
Conflict of interest statement
SY and TS are employees of FUJIFILM Corporation. This does not alter our adherence to PLOS ONE policies on sharing data and materials. The authors have no other competing interests to declare.
Figures


Similar articles
-
Model-based deep learning with fully connected neural networks for accelerated magnetic resonance parameter mapping.Int J Comput Assist Radiol Surg. 2025 May 3. doi: 10.1007/s11548-025-03356-7. Online ahead of print. Int J Comput Assist Radiol Surg. 2025. PMID: 40317423
-
Repeatability-encouraging self-supervised learning reconstruction for quantitative MRI.Magn Reson Med. 2025 Aug;94(2):797-809. doi: 10.1002/mrm.30478. Epub 2025 Feb 27. Magn Reson Med. 2025. PMID: 40014485 Free PMC article.
-
Magnetic resonance parameter mapping using model-guided self-supervised deep learning.Magn Reson Med. 2021 Jun;85(6):3211-3226. doi: 10.1002/mrm.28659. Epub 2021 Jan 19. Magn Reson Med. 2021. PMID: 33464652 Free PMC article.
-
A lightweight adaptive spatial channel attention efficient net B3 based generative adversarial network approach for MR image reconstruction from under sampled data.Magn Reson Imaging. 2025 Apr;117:110281. doi: 10.1016/j.mri.2024.110281. Epub 2024 Dec 11. Magn Reson Imaging. 2025. PMID: 39672285 Review.
-
A review on deep learning MRI reconstruction without fully sampled k-space.BMC Med Imaging. 2021 Dec 24;21(1):195. doi: 10.1186/s12880-021-00727-9. BMC Med Imaging. 2021. PMID: 34952572 Free PMC article. Review.
References
-
- Shafieizargar B, Byanju R, Sijbers J, et al.. Systematic review of reconstruction techniques for accelerated quantitative MRI. Magn Reson Med. 2023;90(3):1172–1208. - PubMed
-
- Chaudhari AS, Black MS, Eijgenraam S, Wirth W, Maschek S, Sveinsson B, et al.. Five-minute knee MRI for simultaneous morphometry and T2 relaxometry of cartilage and meniscus and for semiquantitative radiological assessment using double-echo in steady-state at 3T. J Magn Reson Imaging. 2018;47(5):1328–41. doi: 10.1002/jmri.25883 - DOI - PMC - PubMed
MeSH terms
LinkOut - more resources
Full Text Sources
Medical
Miscellaneous
