

Primary care screening for sexually transmitted infections in the United States from 2019 to 2021
- PMID: 40455810
- PMCID: PMC12129226
- DOI: 10.1371/journal.pone.0325097
Primary care screening for sexually transmitted infections in the United States from 2019 to 2021
Abstract
Background: Early identification and treatment of sexually transmitted infections (STIs) is critical to improve patient outcomes. Barriers to healthcare seeking are potentially exacerbated by COVID-19. This study examined trends in STI testing and positivity from 2019 to 2021 in primary care in the United States.
Methods: This is a retrospective study using the PRIME Registry, a national primary care EHR registry, from January 1, 2019-December 31, 2021. We calculated age-standardized monthly and annual testing rates for chlamydia, gonorrhea, syphilis, and human immunodeficiency virus stratified by gender and race/ethnicity. We also generated quarterly and annual rates for test positivity. Chi-square tests and 95% confidence intervals were used for comparison. 753 practices and 4,410,609 patients were included, with 180,558 having STI tests.
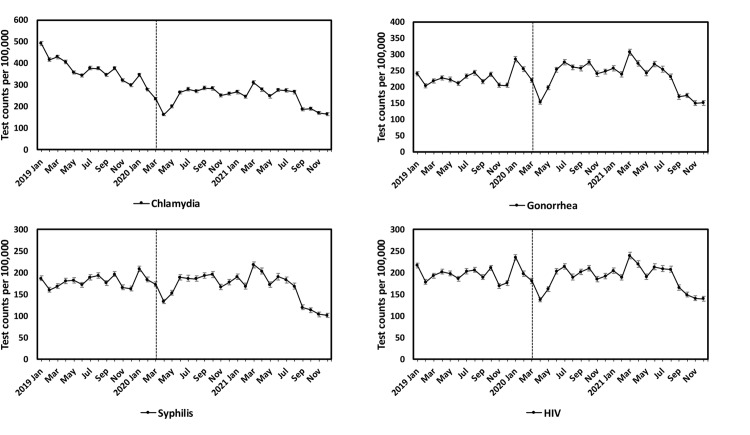
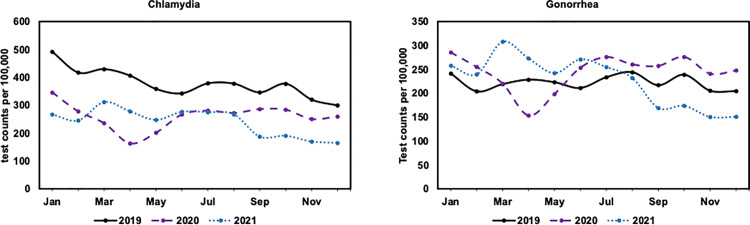
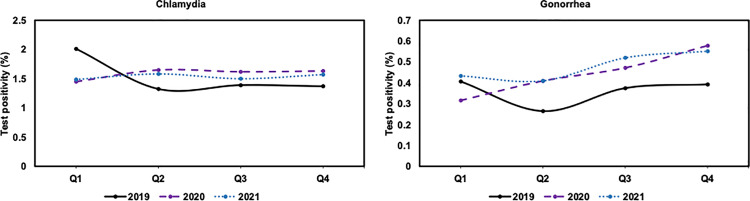
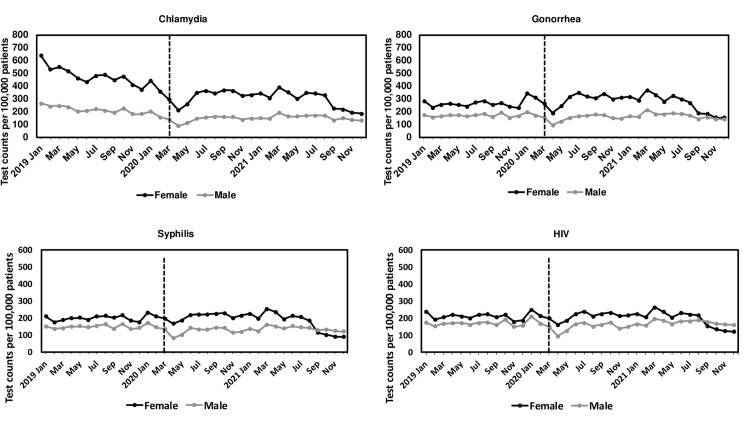
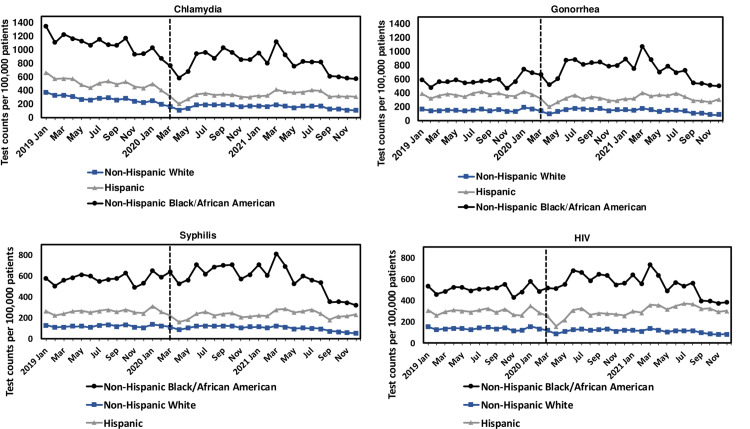
Results: We observed a substantial decline in testing rates for STIs from March-April 2020 (31% for chlamydia, 30% for gonorrhea, 23% for syphilis, 24% for HIV), followed by a rapid increase in May-June 2020 (64% for chlamydia, 65% for gonorrhea, 32% for syphilis, 48% for HIV). Testing rates per 100,000 decreased from 2019 to 2021 for chlamydia (3,592 vs 2,355 vs 2,181) while increased for gonorrhea in 2020 (2,129 vs 2,207 vs 2,057). STI testing rates from 2019 to 2021 for females and non-Hispanic Black or African American patients were higher than other groups. An increase in test positivity from 2019 to 2021 was observed for gonorrhea (0.4% vs 0.4% vs 0.5%) but no significant change for chlamydia (1.5% vs 1.6% vs 1.5%).
Conclusion: Testing rates for STIs substantially dropped during stay-at-home orders early in the pandemic and recovered after these were relaxed. Gender and race/ethnicity STI testing differences may reflect primary care's prioritization of higher risk populations. This study emphasizes the role of primary care EHR data in monitoring and an opportunity for closer collaboration with public health agencies.
Copyright: © 2025 Hao et al. This is an open access article distributed under the terms of the Creative Commons Attribution License, which permits unrestricted use, distribution, and reproduction in any medium, provided the original author and source are credited.
Conflict of interest statement
Neil Kamdar serves as a consultant at the University of North Carolina, Chapel Hill, Sheps Center for Health Policy, and the University of New Mexico, Department of Emergency Medicine. Other authors have no conflicting or competing interests. This does not alter our adherence to PLOS ONE policies on sharing data and materials.
Figures
References
-
- U.S. Department of Health and Human Services. Sexually transmitted infections national strategic plan for the United States: 2021–2025. U.S. Department of Health and Human Services. 2020.
-
- Centers for Disease Control and Prevention. Sexually transmitted disease surveillance 2021. US Department of Health and Human Services. 2023.
-
- Bonett S, Petsis D, Dowshen N, Bauermeister J, Wood SM. The Impact of the COVID-19 Pandemic on Sexually Transmitted Infection/Human Immunodeficiency Virus Testing Among Adolescents in a Large Pediatric Primary Care Network. Sex Transm Dis. 2021;48(7):e91–3. doi: 10.1097/OLQ.0000000000001427 - DOI - PMC - PubMed
MeSH terms
LinkOut - more resources
Full Text Sources
Medical
Miscellaneous
