. 2025 Jun 2;19(6):e0013164.
doi: 10.1371/journal.pntd.0013164. eCollection 2025 Jun.

Hepatic ferroptosis induced by Clonorchis sinensis exacerbates liver fibrosis

Affiliations

Hepatic ferroptosis induced by Clonorchis sinensis exacerbates liver fibrosis

Haoyang Zhang et al. PLoS Negl Trop Dis. .

Abstract

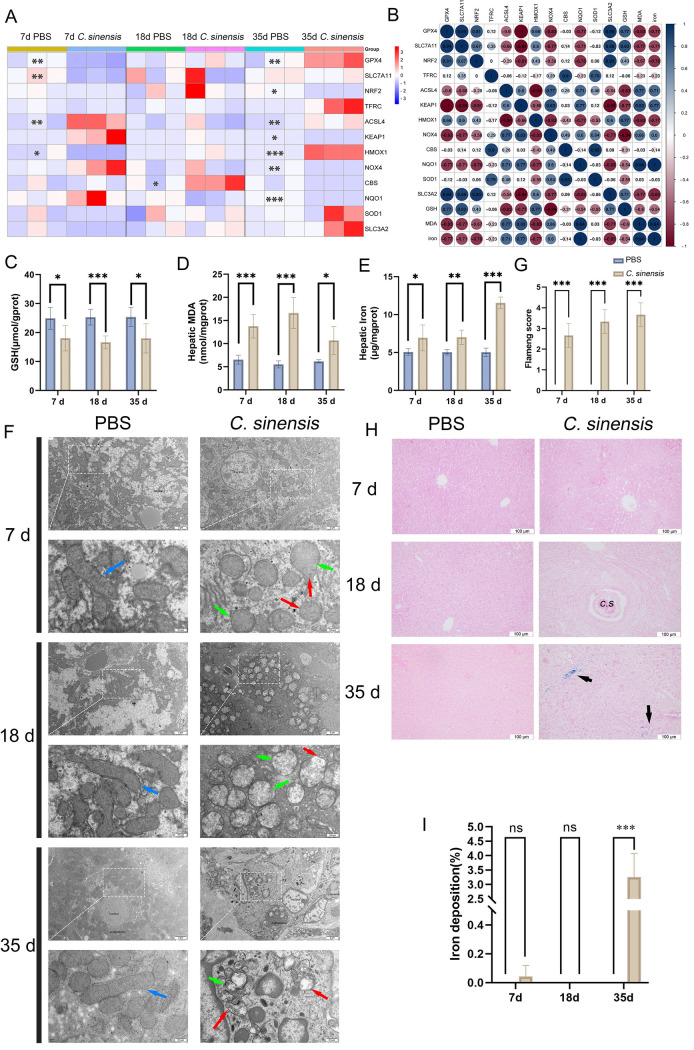
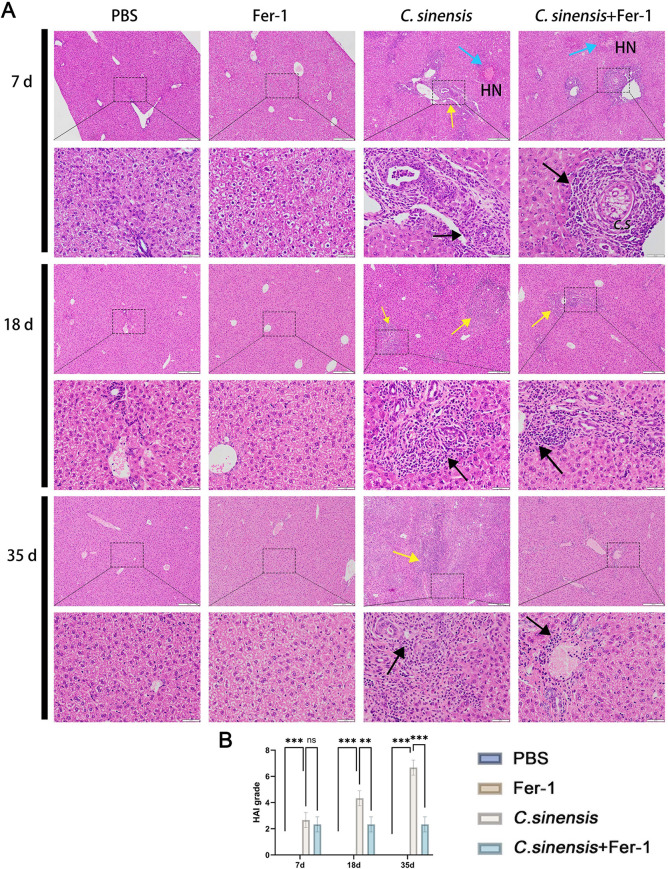
Clonorchis sinensis (C. sinensis) is a food-borne zoonotic parasite link to liver fibrosis and cholangiocarcinoma. Limited understanding of its mechanisms in causing liver fibrosis has impeded therapeutic advances for C. sinensis-induced liver lesions. Ferroptosis, a novel form of cell death involving iron overload and lipid peroxidation, exacerbates liver fibrosis; however, its role in C. sinensis infection remains unexplored. In this study, ferroptosis were detected in C. sinensis-infected C57BL/6 mice as well as in AML12 cells stimulated by C. sinensis excretory/secretory products (ESPs). 12 ferroptosis related genes were screened and we found glutathione peroxidase 4 (GPX4, 7 d), solute carrier family 7 member 11 (SLC7A11, 7 d) and nuclear factor erythroid 2 related factor 2 (Nrf2, 35 d) was significantly decreased in mice. Western blot results confirmed C. sinensis and ESPs down-regulated the expression of GPX4, SLC7A11 and Nrf2. GSH depletion, malondialdehyde (MDA) accumulation, mitochondrial structure damage, and iron overload were found in C. sinensis-infected mice and ESPs-stimulated AML12 cells, suggesting that ferroptosis occurred in vivo and in vitro. Treatment with ferroptosis inhibitor Fer-1 in C. sinensis-infected mice alleviated ferroptosis, reduced the productions of IFN-γ, TNF-α, IL-12 and IL-6, and downregulated transforming growth factor (TGF)-β/Smad pathway activation. In AML12 cells, Fer - 1 pretreatment reduced ESPs - induced ferroptosis and IL-6, TNF-α production. Fer - 1 also alleviated liver lesions, reduced parasite load (65%), α-SMA expression and collagen fiber deposition in infected mice. In conclusion, C. sinensis could cause ferroptosis, which promoted the secretions of IL-6 and TNF-α as well as the activation of TGF-β/Smad pathway, leading to exacerbated liver fibrosis.


Conflict of interest statement

The authors have declared that no competing interests exist.

Figures

Fig 1
Fig 1. Liver ferroptosis caused by C. sinensis infection in mice
. Mice were infected with C. sinensis metacercariae orally, and were euthanized at 7 d.p.i, 18 d.p.i, and 35 d.p.i, respectively. Liver samples were collected for the detection of ferroptosis indicators (n = 15 mice were euthanized per group at each time point). (A) The mRNA expression of ferroptosis-related genes were detected by RT-qPCR, each box represents a single individual, and close to blue represents low level of mRNA expression, close to red represents high level of mRNA expression. (B) Spearman correlation analysis of various ferroptosis indicators in mice was shown by heatmap, circle size represents correlation size, close to dark blue represents positive correlation, and close to dark red represents negative correlation. (C) GSH content of liver in mice was detected. (D) The MDA content of liver in mice was detected. (E) The total iron content of liver in mice was detected. (F) Transmission electron microscopy was used to analyze the ultrastructural changes of mice liver mitochondria, blue arrows point to mitochondria with normal morphology, green arrows point to mitochondria with reduced cristae, and red arrows to mitochondria with membrane damage (The scale bar of the original image and the local magnified image are 2μm and 0.5μm respectively.). (G) Flameng score was used to evaluate the ultrastructure of liver mitochondria in mice. (H) Prussian blue staining was used to visualize liver iron deposition, and the blue marked by black arrows is the iron deposition part (scale bars = 100μm). (I) Semi-quantitative analysis of iron deposition in (H). Data are derived from at least three biologically independent mice per group; *p < 0.05, **p < 0.01, ***p < 0.001, ns means no significant difference.
Fig 2
Fig 2. C. sinensis ESPs facilitated ferroptosis in AML12 cells.
AML12 cells were stimulated with different concentrations of C. sinensis ESPs (5 μg/mL, 10 μg/mL, 25 μg/mL, 50 μg/mL, 100 μg/mL) for 24h, and Erastin (ferroptosis inducer, 10 mM, dissolved in DMSO) was set as positive control. (A) Nrf2, SLC7A11, GPX4 expression in AML12 cells were detected by western blot. (B) Relative gray values of western blot in (A) were analyzed by ImageJ software. (C) Cell viability was detected by CCK8 assay. (D) GSH content in AML12 was detected. (E) MDA content in AML12 was detected. (F) Total iron content in AML12 was measured. AML12 cells were stimulated with C. sinensis ESPs at a concentration of 100 μg/mL for 0h, 6h, 12h, 18h, 24h. (G) Nrf2, SLC7A11, GPX4 expression in AML12 cells were detected by western blot. (H) Relative gray values of western blot in (G) were analyzed by ImageJ software. (I) Cell viability was detected by CCK8 assay. (J) GSH content in AML12 was detected. (K) Relative MDA content in AML12 was detected. (L) Relative total iron content in AML12 was measured. Data are derived from at least three independent cell wells within one experiment; *p < 0.05, **p < 0.01, ***p < 0.001, ns means no significant difference.
Fig 3
Fig 3. Inhibition of ferroptosis alleviated cell viability induced by C. sinensis ESPs.
AML12 cells were pre-treated with 5 μM Fer-1 (ferroptosis inhibitor) for 1h, and then stimulated with 100 μg/mL ESPs for 24h. (A) Nrf2, SLC7A11, GPX4 expression in AML12 cells were detected by western blot. (B) Relative gray values of western blot in (A) were analyzed by ImageJ software. (C) Cell viability was detected by CCK8 assay. (D) The content of reduced GSH in AML12 cells was detected. MDA (E) and total cellular iron (F) content in AML12 cells were detected. The productions of IL-6 (G), IL-12 (H), TNF-α (I) and IFN-γ (J) in cell culture supernatant were detected by ELISA. (K) FerroOrange probe was used to detect the Fe2+ levels in AML12 cells (scale bar = 20μm). (L) Fluorescence intensity levels were quantified using ImageJ software. Data are derived from at least three independent cell wells within one experiment; *p < 0.05, **p < 0.01, ***p < 0.001, ns means no significant difference.
Fig 4
Fig 4. Fer-1 inhibited C. sinensis-induced liver ferroptosis
. Mice infected with C. sinensis metacercariae were treated with Fer-1 (1 mg/kg) by intraperitoneal injection, and euthanized at 7 d.p.i, 18 d.p.i, 35 d.p.i (n = 15 mice were euthanized per group at each time point). (A) Nrf2, SLC7A11, GPX4 expressions in liver were detected by western blot. (B) Relative gray values of western blot in (A) were analyzed by ImageJ software. (C) Reduced GSH content of liver in mice was detected. (D) MDA content of liver in mice was detected. (E) Total iron content of liver in mice was detected. Data are derived from at least three biologically independent mice per group; *p < 0.05, **p < 0.01, ***p < 0.001, ns means no significant difference.
Fig 5
Fig 5. Fer-1 increased SLC7A11 and Nrf2 expression to resist C. sinensis-induced ferroptosis.
Mice infected with C. sinensis metacercariae were treated with Fer-1 (1 mg/kg) by intraperitoneal injection, and euthanized at 7 d.p.i, 18 d.p.i, 35 d.p.i (n = 15 mice were euthanized per group at each time point). (A) Liver sections of mice of each group were immunohistochemically stained for SLC7A11 with brown staining (Area indicated by black arrow, scale bar = 50μm). (B) Liver sections of mice in each group were immunohistochemically stained for Nrf2 with brown staining (Area indicated by red arrow, scale bar = 50μm). (C) Semi-quantitative analysis of the sections by ImageJ software to determine the level of SLC7A11 expression. (D) Semi-quantitative analysis of the sections by ImageJ software to determine the level of Nrf2 expression. Data are derived from at least three biologically independent mice per group; *p < 0.05, **p < 0.01, ***p < 0.001, ns means no significant difference.
Fig 6
Fig 6. Inhibition of ferroptosis mitigated liver injury caused by C. sinensis infection.
Mice infected with C. sinensis metacercariae were treated with Fer-1 (1mg/kg) by intraperitoneal injection, and euthanized at 7 d.p.i, 18 d.p.i, 35 d.p.i (n = 15 mice were euthanized per group at each time point). (A) Body weight changes of mice (PBS, Fer-1, C. sinensis, C. sinensis + Fer-1) from 1 to 35 day were plotted as a line graph. (B) Liver weight and ratio of liver weight to body weight at 35 d.p.i in each group were recorded, blue bars = liver weight, yellow bars = liver/body ratio. (C) The number of intrahepatic parasites of each mouse was counted in C. sinensis and C. sinensis + Fer-1 groups. (D) Liver lesion of mice in PBS, Fer-1, C. sinensis and C. sinensis+Fer-1 groups were observed, green arrows refer to the cholangiectasis that occurred after C. sinensis infection, and black arrow indicated liver fibrosis (scale bar = 1 cm). (E F) The levels of serum AST and ALT levels in mice were detected. Data are derived from at least three biologically independent mice per group; *p < 0.05, **p < 0.01, ***p < 0.001, ns means no significant difference.
Fig 7
Fig 7. Fer-1 alleviated liver lesions caused by C. sinensis.
(A) Liver tissue sections were prepared and stained with H&E. The black arrows indicated inflammatory cell infiltration, the yellow arrows indicated the connective tissue hyperplasia area, the blue arrows indicated the necrotic area (HN: hepatic cells necrotic, C.S: C. sinensis) (scale bar = 100μm; scale bar = 20μm). (B) The degree of liver injure was calculated by hepatic histological activity index (HAI). Data are derived from at least three biologically independent mice per group; **p < 0.01, ***p < 0.001, ns means no significant difference.
Fig 8
Fig 8. Inhibition of ferroptosis alleviated liver fibrosis caused by C. sinensis.
Mice infected with C. sinensis metacercariae were treated with Fer-1 (1mg/kg) by intraperitoneal injection, and euthanized at 7 d.p.i, 18 d.p.i, 35 d.p.i (n = 15 mice were euthanized per group at each time point). (A) The deposition of collagen fibers in the liver was determined by Masson staining, and the deposition of collagen fibers was visualized by blue, with black arrows indicating the area of collagen fiber deposition (scale bar = 100μm). (B) Collagen depositions from each specimen were estimated using ImageJ software. (C–F) TNF-α, IL-6, IL-12 and IFN-γ in mice serum were detected by ELISA. (G) RT-qPCR was used to detect mRNA expression of TGF-β in total RNA from mice liver. (H-J) The phosphorylation of Smad2/3 in liver were analyzed by western blot. Data are derived from at least three biologically independent mice per group; *p < 0.05, **p < 0.01, ***p < 0.001, ns means no significant difference.
Fig 9
Fig 9. Inhibition of ferroptosis alleviated the expression of hepatic
α-SMA, collagen, and collagen induced by C. sinensis in mice. (A) Liver sections of mice of each group were immunohistochemically stained for α-SMA with brown staining (scale bar = 200μm). (B) Liver sections of mice of each group were immunohistochemically stained for collagen Ⅰ with brown staining (scale bar = 200μm). (C) Liver sections of mice of each group were immunohistochemically stained for collagen Ⅲ with brown staining (scale bar = 200μm). (D-F) Semi-quantitative analysis of the sections by ImageJ software to determine the level of α-SMA, collagen Ⅰ, and collagen Ⅲ expression. Data are derived from at least three biologically independent mice per group; *p < 0.05, **p < 0.01, ***p < 0.001, ns means no significant difference.
Fig 10
Fig 10. C. sinensis inhibits the Nrf2, SLC7A11, and GPX4 activity of hepatocyte through the secretion of ESPs, promoting GSH depletion, iron overload, leading to lipid ROS accumulation, and facilitating ferroptosis.
This results in elevated levels of pro-inflammatory cytokines IL-6, IL-12, IFN-γ, and TNF-α in mice. It also promotes the activation of the liver fibrosis signaling pathway TGF-β/Smad and further enhances liver fibrosis.

Similar articles

References

    1. Choi BI, Han JK, Hong ST, Lee KH. Clonorchiasis and cholangiocarcinoma: etiologic relationship and imaging diagnosis. Clin Microbiol Rev. 2004;17(3):540–52, table of contents. doi: 10.1128/CMR.17.3.540-552.2004 - DOI - PMC - PubMed
    1. Qian M-B, Utzinger J, Keiser J, Zhou X-N. Clonorchiasis. Lancet. 2016;387(10020):800–10. doi: 10.1016/S0140-6736(15)60313-0 - DOI - PubMed
    1. Lim JH. Liver flukes: the malady neglected. Korean J Radiol. 2011;12(3):269–79. doi: 10.3348/kjr.2011.12.3.269 - DOI - PMC - PubMed
    1. Xu L-L, Jiang B, Duan J-H, Zhuang S-F, Liu Y-C, Zhu S-Q, et al. Efficacy and safety of praziquantel, tribendimidine and mebendazole in patients with co-infection of Clonorchis sinensis and other helminths. PLoS Negl Trop Dis. 2014;8(8):e3046. doi: 10.1371/journal.pntd.0003046 - DOI - PMC - PubMed
    1. Jeong JH, Yi J, Hwang MK, Hong S-J, Sohn W-M, Kim T-S, et al. The Overactivation of NADPH Oxidase during Clonorchis sinensis Infection and the Exposure to N-Nitroso Compounds Promote Periductal Fibrosis. Antioxidants (Basel). 2021;10(6):869. doi: 10.3390/antiox10060869 - DOI - PMC - PubMed

MeSH terms

Substances