. 2025 Jun 2;19(6):e0012956.
doi: 10.1371/journal.pntd.0012956. eCollection 2025 Jun.

Pre-clinical studies of Schistosoma mansoni vaccines: A scoping review

Affiliations

Pre-clinical studies of Schistosoma mansoni vaccines: A scoping review

Emma L Houlder et al. PLoS Negl Trop Dis. .

Abstract

Background: Schistosomiasis is caused by infection with worms of the genus Schistosoma including S. mansoni. Over 200 million people are infected, sterile immunity does not naturally develop, and no vaccine is available. This could be a critical tool to achieve control and elimination. Numerous candidates have been tested in pre-clinical models, but there is not yet an approved vaccine.

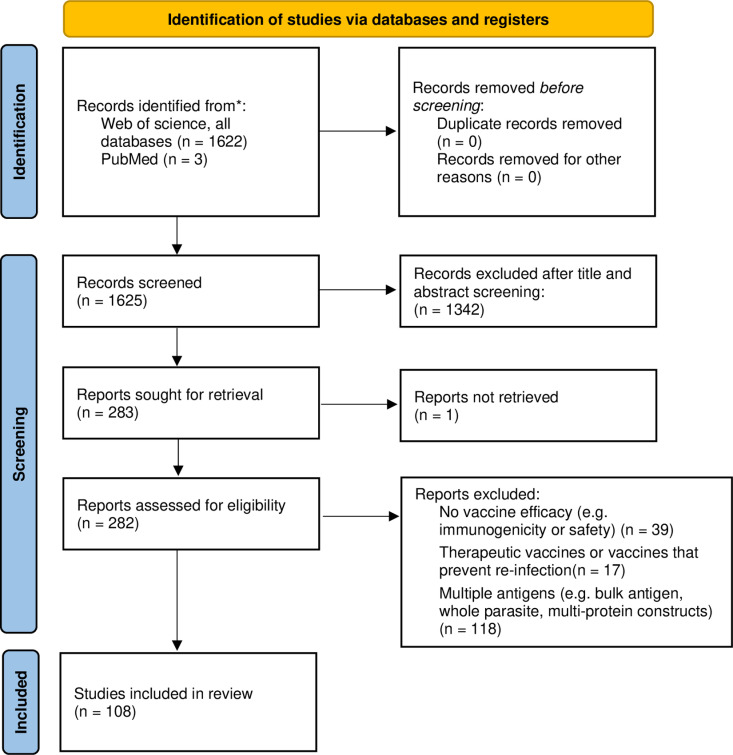
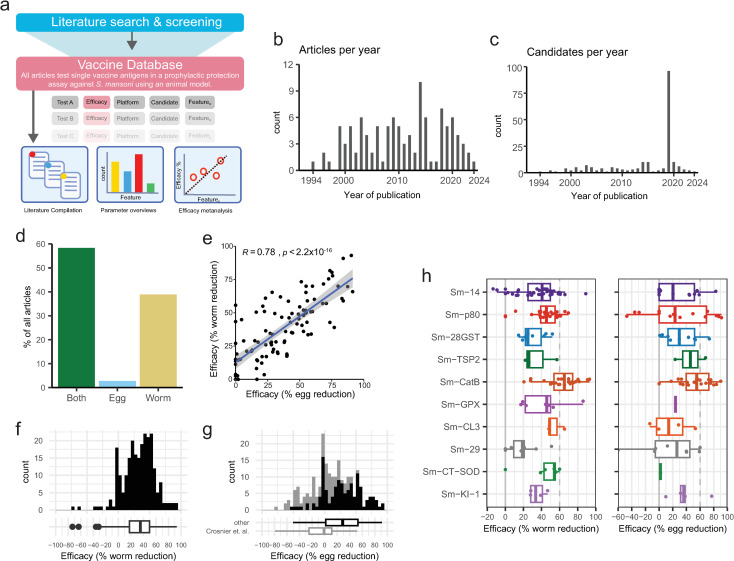
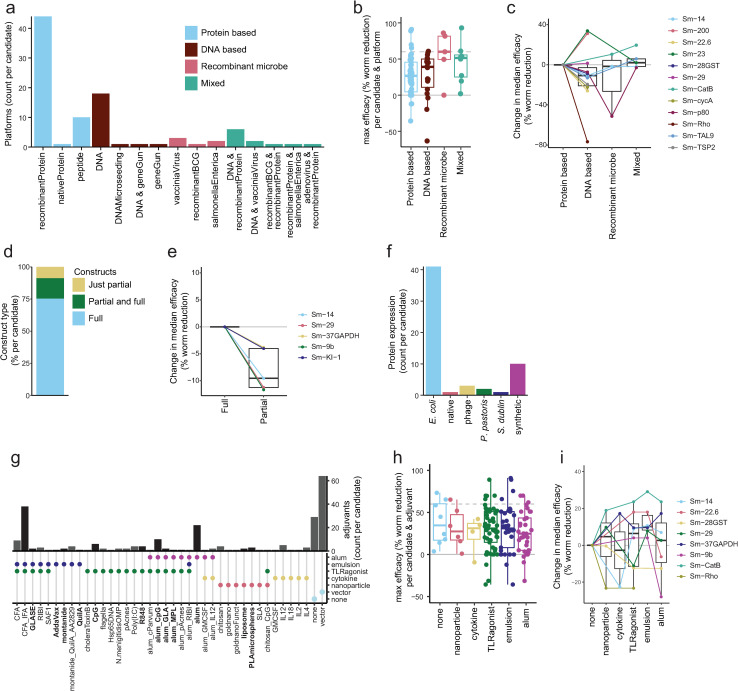
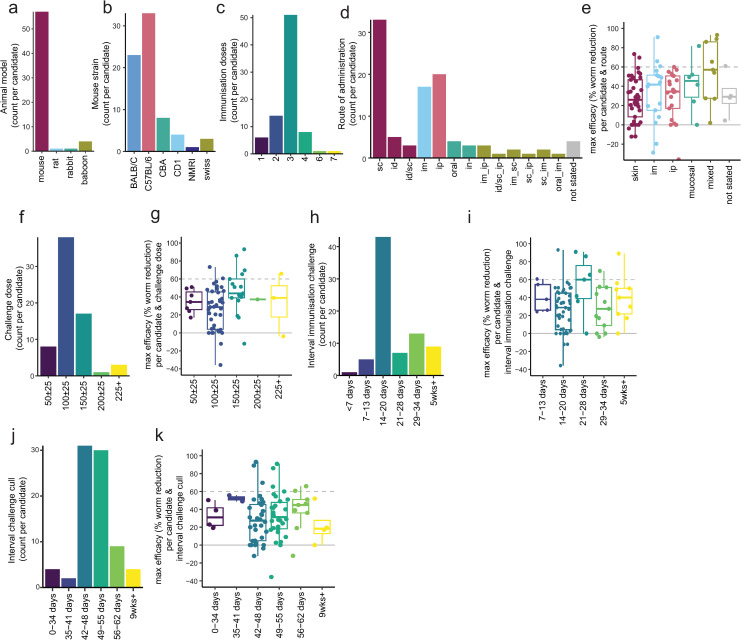
Methodology/principal findings: We conducted a scoping review using a keyword search on Web of Science and a MeSH term search on PubMed. Articles were screened and included if they tested a defined vaccine candidate in a pre-clinical protection assay against S. mansoni between 1994-2024. Vaccine formulation, study design, and efficacy parameters from all articles were extracted. This data was summarised graphically, with the influence of different parameters appraised. A total of 141 candidate antigens were tested in 108 articles over the last 30 years, with most antigens tested only once and three (Sm-CatB, Sm-p80, and Sm-14) tested over 20 times. The median protective efficacy against worms was 35%. 10 antigens achieved over 60% efficacy, and only two (Sm-p80 and Sm-CatB) over 90%. Large variations in efficacy were observed with all repeatedly tested antigens, likely attributable to differing formulations and study designs. The effect of these varying parameters on the resultant efficacy was evaluated.

Conclusions: A few vaccine candidates have achieved promising efficacy in pre-clinical studies. Most vaccines tested however have efficacy that falls short of that required for an impactful schistosomiasis vaccine. The diversity in study designs makes comparing vaccine targets a challenge. Use of consistent and optimized vaccine formulation (including adjuvant and platform) and study design parameters is critical to expedite the development of a schistosome vaccine.


Conflict of interest statement

The authors have declared that no competing interests exist.

Figures

Fig 1
Fig 1. PRISMA 2020 flow diagram including searches of databases and registers only.
Fig 2
Fig 2. Overview and efficacy.
a) Overview of review strategy b) Histogram of the number of included articles per year and c) candidate antigens tested per year between 1994 and 2024. d) Proportion of candidates where vaccine efficacy is tested via worm counts, egg counts or both. e) Correlation between worm and egg efficacy in all tests in which both were measured. The blue line and associated grey confidence interval represents a linear regression, with pearson’s correlation coefficient and p value reported. f & g) Histogram of the efficacy against worms (f) or eggs (g) in all vaccine tests, summarised in boxplot below. h) Boxplots showing the efficacy against worms (left) or eggs (right) in all tests of antigens that have ever achieved over 60% efficacy.
Fig 3
Fig 3. Vaccine formulation.
a) Barplot showing platforms used for each schistosome vaccine antigen. b) Boxplot showing the maximum efficacy of each schistosome vaccine candidate by platform type tested. c) Line and boxplots showing change in median efficacy of candidates tested in different platform types, compared to protein based platforms. d) Proportion of candidates tested as full constructs, partial constructs or both. e) Line and boxplots showing change in median efficacy of candidates tested as partial constructs, compared to full constructs. f) Barplot showing recombinant protein system used for each protein based tested antigen. g) Bar and dotplot showing adjuvants used for each tested antigen, with adjuvant characteristics indicated on the dotplot below. Adjuvants applicable for human use (or with a similar formation to human-applicable adjuvants) are shown in bold, with black bars. h) Boxplot showing the maximum efficacy of each schistosome vaccine candidate by adjuvant characteristics. As adjuvants may have multiple characteristics, a single test of a vaccine antigen may appear in multiple boxplots. i) Line and boxplots showing change in median efficacy of candidates tested as proteins or peptides with different adjuvants, compared to no adjuvant. When count per candidate is plotted, each candidate is counted once per group (e.g., platform) to avoid over-representing frequently tested candidates and provide a balanced overview.
Fig 4
Fig 4. Study design.
a) Barplot showing animal model used for each tested antigen. b) Barplot showing mouse strain used for each antigen tested in a mouse model. c) Barplot showing the number of immunisation doses used for each tested antigen. d) Barplot showing administration route for each vaccine antigen. e) Boxplot showing the maximum efficacy of each schistosome vaccine candidate by type of administration route. f) Barplot showing cercarial challenge dose for each vaccine antigen. g) Boxplot showing the maximum efficacy of each schistosome vaccine candidate, grouped by number of cercariae used in the challenge. h) Barplot showing gap between final immunisation and challenge for each vaccine antigen. i) Boxplot showing the maximum efficacy of each schistosome vaccine candidate by the interval between immunisation and challenge j) Barplot showing gap between cercariae challenge and cull (measurement of worm/egg counts) for each vaccine antigen. k) Boxplot showing the maximum efficacy of each schistosome vaccine candidate, grouped by the interval between challenge and cull (measurement of worm/egg counts). When count per candidate is plotted, each candidate is counted once per group (e.g., animal model) to avoid over-representing frequently tested candidates and provide a balanced overview.
Fig 5
Fig 5. Linear model of parameter effect on efficacy. A linear model was fitted to dissect how the choice of candate, vaccine formulation and study design impacted efficacy (worm reduction). a) Volcano plot showing significant (FDR < 0.05) parameters. b) Bar plot showing the coefficients for all variables included in the model. Red denotes a negative coefficient, green a positive coefficient. Variables that significantly affected the efficacy are shown in a mid colour (p < 0.05) or dark colour (FDR < 0.05).

References

    1. Steinmann P, Keiser J, Bos R, Tanner M, Utzinger J. Schistosomiasis and water resources development: systematic review, meta-analysis, and estimates of people at risk. Lancet Infect Dis. 2006;6(7):411–25. doi: 10.1016/S1473-3099(06)70521-7 - DOI - PubMed
    1. Organization WH. Global report on neglected tropical diseases 2024. Geneva: Organization WH. 2024.
    1. Gordon CA, Kurscheid J, Williams GM, Clements ACA, Li Y, Zhou X-N, et al. Asian schistosomiasis: current status and prospects for control leading to elimination. Trop Med Infect Dis. 2019;4(1):40. doi: 10.3390/tropicalmed4010040 - DOI - PMC - PubMed
    1. Colley DG, Bustinduy AL, Secor WE, King CH. Human schistosomiasis. Lancet. 2014;383(9936):2253–64. doi: 10.1016/S0140-6736(13)61949-2 - DOI - PMC - PubMed
    1. Verjee MA. Schistosomiasis: still a cause of significant morbidity and mortality. Research and Reports in Tropical Medicine. 2020;10:153–63. - PMC - PubMed

Publication types

MeSH terms