Review
. 2025 Jun 25;125(12):5830-5847.
doi: 10.1021/acs.chemrev.4c00899. Epub 2025 Jun 2.

Probing Molecular Properties at Atomic Length Scale Using Charge-State Control

Affiliations
Review

Probing Molecular Properties at Atomic Length Scale Using Charge-State Control

Laerte L Patera et al. Chem Rev. .

Abstract

The charge state plays a critical role in governing the structural, electronic, and chemical properties of molecules. Controlling the charge state of individual molecules provides a powerful tool for exploring fundamental processes, such as redox reactions, selective bond rearrangements, molecular excitations, charge transfer, and modulation of reaction pathways at the single-molecule level. Recent advancements in scanning tunneling microscopy (STM) and atomic force microscopy (AFM) have enabled precise and stable manipulation of molecular charge states, allowing for detailed, high-resolution studies of charge-state-dependent phenomena. In this review, we discuss the principles and methodologies for charge-state control in STM and AFM, with a focus on strategies for stabilizing charge states in a controlled experimental environment. We also examine key advancements in the ability to detect and manipulate intra- and intermolecular charge transfer, providing insights into charge-mediated processes, such as structural rearrangements, electronic states, and reactivity at the atomic scale. Finally, we highlight the potential of charge-state control to probe electronic excited states and resolve spin-coherence in individual molecules.


Figures

1
1
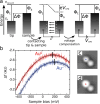
(center) Experimental scheme of probing, controlling, and exploiting charge states of molecules adsorbed on multilayer insulating films using AFM. The film thickness is chosen such that the tunneling of electrons between an adsorbed molecule and the supporting metal is suppressed on experimentally relevant time scales (crossed-out arrow). However, by applying a voltage (sample bias) between tip and supporting metal, electron tunneling between tip and adsorbed molecules can be controlled. Such an experimental setup enables single-molecule charge-state detection and control by AFM. The top panel illustrates how a charging event is detected by AFM, typically observed as a vertical step in the frequency shift (Δf) upon sweeping the sample bias. AFM imaging can reveal the location of the charge. Insets show constant-height AFM data at large tip–sample distances. By combining charge-state control with the versatile atomic-scale-characterization possibilities of AFM this approach can be used for a detailed examination of the ground-state electronic properties in different charge states (left panel). Insets in the left panel show alternate-charging scanning tunneling microscopy (AC-STM) images, which indicate the impact of excess charges on the spatial distribution of molecular orbitals. Structural properties in different charge states are revealed by CO-tip AFM data (right panel). Furthermore, charge-state-induced chemical reactions and excited electronic states can be studied using this approach (bottom left and right panel, respectively). Center and top panels adapted with permission from ref . Copyright 2015 Springer Nature. Left panel adapted with permission from ref . Copyright 2019 Springer Nature. Right panel adapted with permission from ref . Copyright 2019 AAAS.
2
2
(a) Working principle of Kelvin-probe methods, depicting the energy levels of tip and sample having work functions Φt and Φs, respectively, differing by ΔΦ. Upon electrically connecting the metals, electrons flow until their Fermi levels (E F) are aligned, resulting in an electric field in the junction. The surface charges creating the field lead to an attractive electrostatic force between the electrodes. By applying a voltage V = V CPD, the contact potential difference is compensated for and the electric field is nullified (assuming an ideal plate capacitor geometry). (b) Measured Δf(V) above an individual anionic and neutral gold adatom. The voltage of the peak of the so-called Kelvin parabola is the local contact potential difference (LCPD), minimizing the electric field in the junction. (c) and (d) STM images taken before and after applying a bias pulse and manipulating the charge state of a gold adatom on bilayer NaCl on Cu(111) from anionic to neutral, respectively. (b–d) Adapted with permission from ref . Copyright 2009 AAAS.
3
3
(a) Schematic of an AFM experiment enabling charge-state control. The transfer of electrons can occur only between tip and adsorbate but not between adsorbate and metal substrate for energies within the bandgap of the insulator. (b) KPFS, i.e., Δf(V) spectra, showing the manipulation of charge state of a molecular adsorbate. Sweeping the bias downward (upward) an electron is detached from (attached to) the adsorbate, see upper (lower) panel. The hysteresis between electron attachment and detachment is related to the reorganization energy (Figure ), giving rise to a voltage region of charge-state bistability. Adapted with permission from ref . Copyright 2015 Springer Nature.
4
4
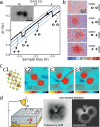
(a,b) Lateral charge transfer between individual molecules. (a) Δf(V) spectrum performed on top of one of the pentacene molecules shown in the inset (constant-height AFM image). Each step in Δf indicates a single charge-transfer process, with individual segments of the Δf(V) spectrum corresponding to different charge configurations. (b) Constant-height AFM images revealing the locations of excess charges. A representation of the corresponding charge configurations is shown next to each image. (c) Structural model (c1) and constant-height Δf images (c2–c4) of a molecule featuring two redox centers separated by a linker; (c2) dication, that is, after attachment of two positive charges, +2h (two added holes); (c3) cation, after attachment of one positive charge, +1h (one added hole); (c4) neutral charge state. The sharp line observed in the Δf image in the cationic state reflects the shuttling of charge between two redox centers of the molecule induced by the tip oscillation. (d) Schematic illustration (left) of the AFM measurement of a molecular assembly. Constant-height AFM images of an assembly of three-by-three molecules (positions as indicated in turquoise) showing the Δf (center) and the dissipation (right) signals. (a,b) Adapted with permission from ref . Copyright 2015 Springer Nature. (c) Adapted with permission from ref . Copyright 2020 Springer Nature. (d) Reproduced with permission from ref . Copyright 2020 American Chemical Society.
5
5
(a) Schematic of an oscillating AFM cantilever driving single-electron transfer between a two-dimensional electron gas (2DEG) and a quantum dot (QD) below the AFM tip. (b) Dissipation as a function of sample bias, revealing the quantized charging of the QD. The peaks are spaced by the Coulomb charging energy, with further contributions corresponding to energy differences (ΔE) between different shells. (c,d) Topography and frequency-shift AFM data, respectively, revealing QD locations and charging rings. (e) STM measurement setup for a graphene/BN device on SiO2. The graphene is grounded via a gold/titanium electrode, and a back-gate voltage (V G) is applied to a doped Si electrode. (f) Ionization of a Co adatom on a gated graphene device detected by a charging ring with dI/dV mapping. (g) dI/dV spectrum of a tetrafluoro-tetracyanoquinodimethane (F4TCNQ) molecule on gated graphene/BN reveals vibronic satellites for the molecule being at V = 0 V neutral (blue) and charged (red). (a–d) Reproduced figures with permission from ref . Copyright 2010 PNAS. (e) Reproduced with permission from ref . Copyright 2020 American Chemical Society. (f) Reproduced with permission from ref . Copyright 2011 Springer Nature. (g) Reproduced with permission from ref . Copyright 2016 Springer Nature.
6
6
Charge-state control to break and form bonds. (a) Δf(V) spectrum for the double negative charging of diiodo-naphthoperylene (DINP). Circles indicate charging events. (b) Sequence of constant-Δf images of DINP, neutral, and prior dissociation (top panel); product after the attachment of two electrons (middle panel); restored neutral DINP after the detachment of two electrons from the dissociated system (bottom panel). (c) Reaction pathway of DINP for the double reduction of a neutral molecule and double oxidation of the dissociated system. (d) Δf(V) spectrum of the reformation of the aryne and iodines into DINP. (a,d) Arrows indicate the sample bias-sweep direction, the first sweep in black, the successive backward sweep in red. (a–d) Reproduced figures with permission from ref . Copyright 2019 American Physical Society.
7
7
(a) Chemical structure of tetracyanoquinodimethane (T) and constant-height AFM images of the neutral, anionic, and dianionic T. Scale bars represent 5 Å. (b) Laplace-filtered constant-height AFM images of neutral and dianionic porphine (F), and below resonance structures of neutral and dianionic F. The positions of the inner hydrogens in the AFM images correspond to the displayed resonance structures. The expected annulene-type conjugation pathways are indicated in red. Note the relatively large bond order and short apparent length in the AFM image of F0 of the bond, which is indicated by the red arrow. This bond is not part of the conjugation pathway and is a formal double bond in both resonance structures in the neutral charge state. Its contrast changes for the dianion in which the conjugation pathway extends over this bond. (c) Measured apparent bond lengths of the peripheral C–C bonds of the pyrrole (cyan) and azafulvene (red) rings, indicated in the inset, as a function of charge state. Shown measurements on multilayer NaCl films (a–c). Adapted with permission from ref Copyright 2019 AAAS.
8
8
(a) Schematic of the total free-energy curve for a neutral (NPc0) and positively charged (NPc+) molecule with respect to the Fermi level of the tip. (b) Single-electron energy ε diagrams that correspond to the voltages of electron detachment from NPc0 to the tip (ox0, left) and electron reattachment from the tip to NPc+ (red+, right). The difference in electron energies corresponds to the reorganization energy. Below, the corresponding schematics for the total free energy at the respective voltage are depicted. (c,d) Extracted tunneling current I based on single-electron transfers and statistical analysis for a molecule adsorbed on a multilayer NaCl film. The plots also display the fitted Gauss error function (black line) and its derivative (red line). (c) Electron detachment from a neutral molecule. (d) Electron attachment to a positively charged molecule. (e) Scheme of the experiment to probe electron–nuclear coupling, where a molecule is attached to a template-stripped gold surface. (f) Derivative of the AFM frequency-shift response with respect to the tipbias V B. (a–d) Adapted with permission from ref . Copyright 2018 Springer Nature. (e,f) Reproduced (adapted) with permission from ref . Copyright 2019 American Chemical Society.
9
9
(a) Working principle of alternate-charging STM (AC-STM). Sample-bias pulses synchronized with the cantilever motion are added to a static sample voltage, driving the alternating charging (red and blue) of the molecules under the tip. The charging leads to additional electrostatic forces acting on the cantilever, adding to the background forces. (b) Molecular structure of CuPc. (c) Energy (E) level scheme of neutral and negatively charged molecule, showing the Jahn–Teller effect (JTE) in anionic CuPc. Calculated LUMO contours of gas-phase CuPc are shown. (d,e) Electronic transitions: 0→1 (d) and 1→0 (e). (a–e) Adapted with permission from ref . Copyright 2019 Springer Nature.
10
10
Probing electronic excited states through charge-state control. (a) Many-body electrons associated with different charge-state transitions. An increase (decrease) of sample bias shifts the cationic states upward (downward) with respect to the states of the neutral molecule. Controlled initial cation D0 cation formation is highlighted with a curved black arrow. The relaxation energies are labeled Δ0 (electron detachment from molecule) and Δ1, Δ2, and Δ3 (electron attachment to molecule). S0, T1,2, and S1,2 represent the ground state, energetically lowest triplet excited states, and lowest energy singlet excited states, respectively. T1 and T2 as well as S1 and S2 are quasi-degenerate because of the small energy difference between LUMO and LUMO+1 in NPc. Starting from D0 cation, red+ 1 is the transition to S0, red+ 2 is the transition to T1,2, and red+ 3 is the transition to S1,2. (b) Analysis of the attachment of an electron to a cationic molecule as a function of probing sample bias, V probe. Extracted tunneling current I based on single-electron transfers. (c) Triplet decay of a pentacene molecule. The population as a function of dwell time t D is extracted from repeated cycles of single-electron-transfer processes. A triple-exponential fit is used to determine the three triplet-state lifetimes involved in the transition to the ground-state S0. All data shown was obtained on molecules on multilayer NaCl substrates. (a,b) Reproduced figures with permission from ref . Copyright 2021 by the American Physical Society. (c) Adapted from ref . Reproduced with permission from AAAS.

References

    1. Gross L., Mohn F., Moll N., Liljeroth P., Meyer G.. The Chemical Structure of a Molecule Resolved by Atomic Force Microscopy. Science. 2009;325(5944):1110–1114. doi: 10.1126/science.1176210. - DOI - PubMed
    1. Gross L., Mohn F., Moll N., Schuler B., Criado A., Guitian E., Pena D., Gourdon A., Meyer G.. Bond-Order Discrimination by Atomic Force Microscopy. Science. 2012;337(6100):1326–1329. doi: 10.1126/science.1225621. - DOI - PubMed
    1. Pavliček N., Schuler B., Collazos S., Moll N., Pérez D., Guitián E., Meyer G., Peña D., Gross L.. On-Surface Generation and Imaging of Arynes by Atomic Force Microscopy. Nat. Chem. 2015;7(8):623–628. doi: 10.1038/nchem.2300. - DOI - PubMed
    1. Pavliček N., Mistry A., Majzik Z., Moll N., Meyer G., Fox D. J., Gross L.. Synthesis and Characterization of Triangulene. Nat. Nanotechnol. 2017;12(12):308–311. doi: 10.1038/nnano.2016.305. - DOI - PubMed
    1. Doppagne B., Chong M. C., Bulou H., Boeglin A., Scheurer F., Schull G.. Electrofluorochromism at the Single-Molecule Level. Science. 2018;361(6399):251–255. doi: 10.1126/science.aat1603. - DOI - PubMed

LinkOut - more resources