

Declining coral calcification to enhance twenty-first-century ocean carbon uptake by gigatonnes
- PMID: 40455984
- PMCID: PMC12167964
- DOI: 10.1073/pnas.2501562122
Declining coral calcification to enhance twenty-first-century ocean carbon uptake by gigatonnes
Abstract
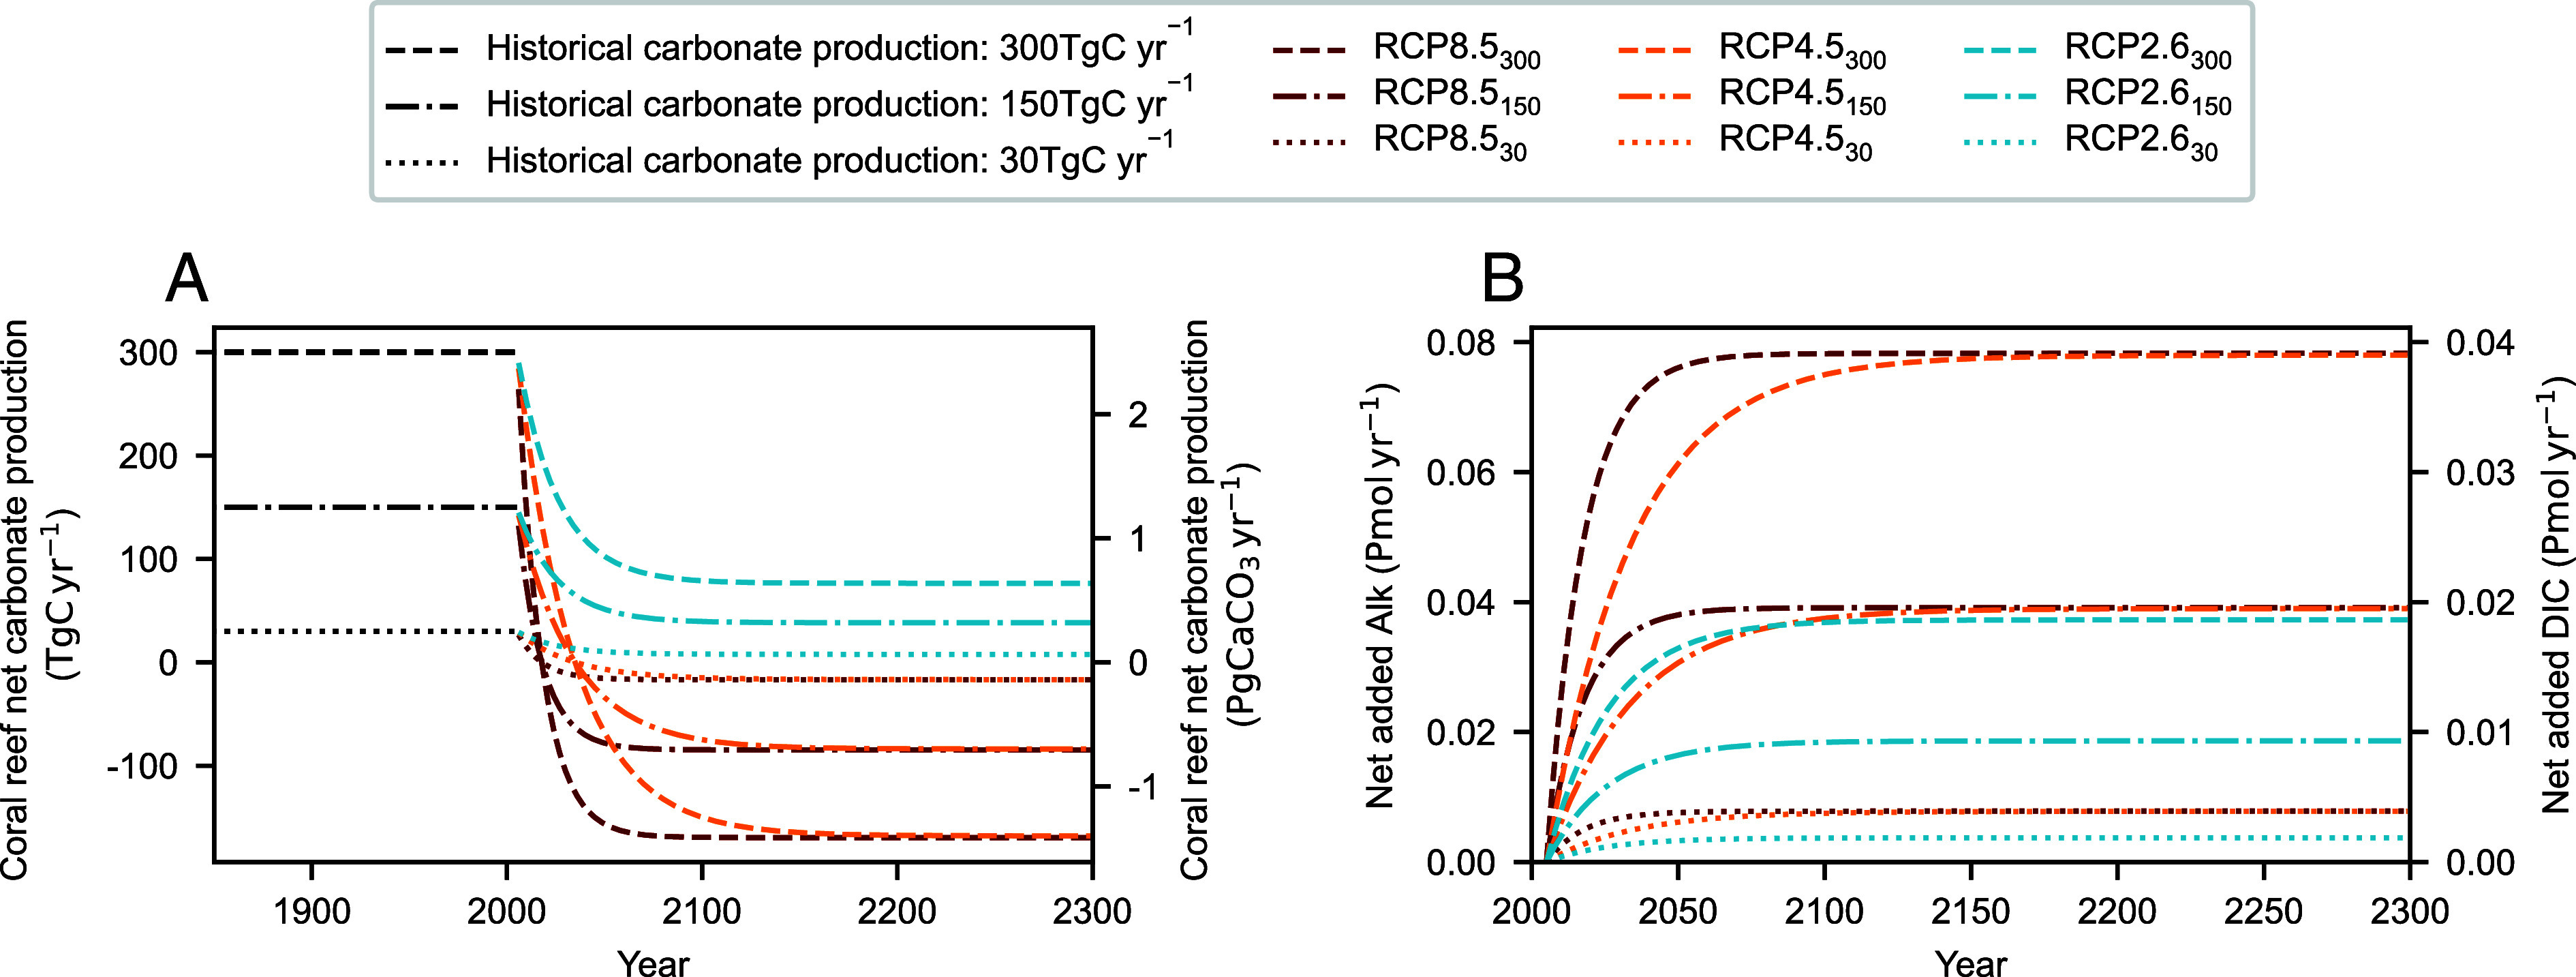
The sensitivity of coral reefs to climate change is well established. As the oceans warm and acidify, the calcification of coral reefs declines with net calcium carbonate dissolution projected under even moderate emissions trajectories. The impact of this on the global carbon cycle is however yet to be accounted for. Here, we use a synthesis of the sensitivity of coral reef calcification to climate change, alongside reef distribution products to estimate alkalinity and dissolved inorganic carbon fluxes resulting from reductions in reef calcification. Using a global ocean biogeochemical model, we simulate the impact on ocean carbon uptake under different emissions scenarios, accounting for uncertainty in present-day calcification rates. Reductions in net coral reef carbonate production can enhance the ocean carbon sink by up to 1.25 GtCO2 y-1 by midcentury (0.48 GtCO2 y-1 median estimate) with cumulative ocean carbon uptake up to 13% greater by 2300 (7% median estimate). Our findings indicate that accounting for the coral reef feedback in projections will increase estimates of the remaining carbon budget associated with global warming thresholds, as well as the likelihood that net zero emissions can be achieved without negative emissions.
Keywords: calcification; carbon; climate; coral reef; feedback.
Conflict of interest statement
Competing interests statement:The authors declare no competing interest.
Figures


References
-
- Canadell J. G., et al. , “Global carbon and other biogeochemical cycles and feedbacks” in IPCC AR6 WGI, Final Government Distribution, (IPCC, 2021).
-
- Friedlingstein P., et al. , Global carbon budget 2022. Earth Syst. Sci. Data 14, 4811–4900 (2022).
-
- Gooya P., Swart N. C., Hamme R. C., Time-varying changes and uncertainties in the CMIP6 ocean carbon sink from global to local scale. Earth Syst. Dynam. 14, 383–398 (2023).
-
- Liddicoat S. K., et al. , Compatible fossil fuel CO2 emissions in the CMIP6 Earth system models’ historical and shared socioeconomic pathway experiments of the twenty-first century. J. Climate 34, 2853–2875 (2021).
-
- Jones C., et al. , Twenty-first-century compatible CO2 emissions and airborne fraction simulated by CMIP5 Earth system models under four representative concentration pathways. J. Climate 26, 4398–4413 (2013).
MeSH terms
Substances
Grants and funding
LinkOut - more resources
Full Text Sources
Research Materials
