. 2025 Jun 10;122(23):e2505805122.
doi: 10.1073/pnas.2505805122. Epub 2025 Jun 2.

MyD88 knockdown by RNAi prevents bacterial stimulation of tubeworm metamorphosis

Affiliations

MyD88 knockdown by RNAi prevents bacterial stimulation of tubeworm metamorphosis

Emily Darin et al. Proc Natl Acad Sci U S A. .

Abstract

Diverse animals across the tree of life undergo the life-history transition of metamorphosis in response to bacteria. Although immunity has been implicated in this metamorphosis in response to bacteria, no functional connection has yet been demonstrated between immunity and metamorphosis. We investigated a host-microbe interaction involving a marine tubeworm, Hydroides elegans, that undergoes metamorphosis in response to Pseudoalteromonas luteoviolacea, a metamorphosis-inducing marine bacterium. By creating a marine bacteria-mediated RNA interference approach, we show that myeloid differentiation factor 88 (MyD88), a critical immune adaptor for Toll-like receptor and interleukin pathways, is necessary for the stimulation of metamorphosis in response to bacteria. In addition to a developmental role, we show that MyD88 is necessary for survival during exposure to the bacterial pathogen Pseudomonas aeruginosa, showing that Hydroides utilizes MyD88 during both development and an immune response. These results provide a functional characterization of the innate immune system involved in an animal's metamorphosis.

Keywords: MyD88; bacteria; development; immunity; metamorphosis.


Conflict of interest statement

Competing interests statement:E.D., M.V.F. and N.J.S. are co-inventors on provisional US patent application serial number 63/687,110, entitled “Genetically Engineered Marine Bacteria for Biomaterial Production, Probiotic Use in Aquaculture and Marine Environmental Restoration” and assigned to San Diego State University Research Foundation.

Figures

Fig. 1.
Fig. 1.
Hydroides larvae feed on genetically modified marine bacteria. (A) Model of double-stranded RNA (dsRNA) delivery via bacterial feeding to Hydroides larvae. The RNA interference (RNAi) plasmid is carried by a feeder bacterium that serves as a food source but does not stimulate metamorphosis. The tubeworm’s RNA-Induced Silencing Complex (RISC) cleaves the dsRNA into small RNA fragments (siRNA), leading to targeted mRNA degradation. (B) Graph of Hydroides metamorphosis after 24 h bacterial exposure to MACs (Metamorphosis-Associated Contractile structures), artificial seawater (ASW), Photobacterium mandapamensis strains 4.11 and 4.16, Pseudoalteromonas piratica, Vibrio harveyi, and Vibrio fortis. Data are generated from three independent experiments (n = 3). Error bars represent SD. (C) Micrograph of Hydroides larvae fed P. mandapamensis 4.11 wild-type or P. mandapamensis 4.11 mRuby-tagged bacteria. Dashed line outlines stomach (st) and anal vesicle (av) in Hydroides larvae.
Fig. 2.
Fig. 2.
Gene-specific knockdown in Hydroides via bacteria feeding and RNA interference. (A) DIC micrographs of Hydroides larvae after 24-h feeding P. mandapamensis 4.11 with pDS-gfp, pDS-αtubulin, or pDS-CA1. The white arrow indicates the location of ciliary band loss. (B) Percent larvae fed P. mandapamensis pDS-gfp or pDS-αtubulin with ciliary band after 24 h. Data are generated from three independent experiments (n = 3) with an average of 300 larvae scored for each treatment (****P < 0.0001, calculated using a chi-square test with Yates’ correction). Error bars represent SD. (C) Counts of larvae with CA1 HCR expression 24 h after feeding P. mandapamensis pDS-gfp or pDS-CA1. Data are generated from an average of 30 larvae scored for each of three independent experiments (n = 3) (****P < 0.0001, calculated using a chi-square test with Yates’ correction). Error bars represent SD. (D) HCR of αtubulin (turquoise), CA1 (magenta), and DNA (DAPI, gray) in larvae fed P. mandapamensis pDS-gfp after 24 h. Lower Left 3.4× zoomed in panel of ciliary band and Lower Right 3.4× zoomed in panel of CA1 gland for pDS-gfp exposed larvae. (E) HCR of αtubulin (turquoise), CA1 (magenta), and DNA (DAPI, gray) in larvae fed P. mandapamensis pDS-αtubulin after 24 h. Lower Left 3.4× zoomed in panel of ciliary band and Lower Right 3.4× zoomed in panel of CA1 gland for pDS-αtubulin exposed larvae. (F) HCR of αtubulin (turquoise), CA1 (magenta), and DNA (DAPI, gray) in larvae fed P. mandapamensis pDS-CA1 after 24 h. Lower Left 3.4× zoomed in panel of ciliary band and Lower Right 3.4× zoomed in panel of CA1 gland for pDS-CA1 exposed larvae. (G) qPCR of the Hydroides αtubulin gene in larvae fed P. mandapamensis pDS-gfp, pDS-αtubulin, or pDS-CA1 after 24 h. Data are generated from ~500 larvae in each of three technical replicates for each of three independent experiments (n = 3). Fold change values calculated using the DDCT method (Letters represent one-way ANOVA and Tukey post hoc test results, P < 0.001). Error bars represent SD. (H) qPCR of the Hydroides CA1 gene in larvae fed P. mandapamensis pDS-gfp, pDS-αtubulin, or pDS-CA1 after 24 h. Data are generated from ~500 larvae in each of three technical replicates for each of three independent experiments (n = 3). Log2 fold change values calculated using the DDCT method (Letters represent one-way ANOVA and Tukey post hoc test results, P < 0.001). Error bars represent SD. (I) Counts of larvae with anti-αtubulin staining after feeding P. mandapamensis pDS-gfp, pDS-αtubulin, or pDS-CA1 for 24 h. The graph is an average of three biological replicates (n = 3) with 30 larvae per replicate per treatment (chi-square test with Yates’ correction, ****P < 0.0001 comparing pDS-gfp to pDS-αtubulin, n.s. comparing pDS-gfp to pDS-CA1). Error bars represent SD.
Fig. 3.
Fig. 3.
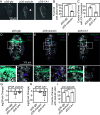
MyD88 knockdown inhibits metamorphosis. (AC) DIC micrographs of Hydroides larvae after 24-h feeding on P. mandapamensis (A) pDS-gfp or (B) pDS-MyD88 or (C) exposure to a MyD88 inhibitor (TJ-M2010-5) and subsequent 24 h exposure to MACs. (D) Percent metamorphosis after 24-h feeding P. mandapamensis pDS-gfp, P. mandapamensis pDS-MyD88, DMSO solvent (0.05%) or exposure to a MyD88 inhibitor (TJ-M2010-5) and subsequent 24 h exposure to MACs. Data are generated from three independent experiments (n = 3) with an average of 300 larvae scored for each treatment. Data are analyzed using a chi-square test with Yates’ correction (****P < 0.0001). Error bars represent SD. (E) Counts of larvae showing MyD88 HCR expression after 24-h feeding P. mandapamensis pDS-gfp or P. mandapamensis pDS-MyD88 and subsequent 5 min exposure to MACs. The graph is an average of three biological replicates (n = 3) with 30 larvae per replicate per treatment. Data are analyzed using a chi-square test with Yates’ correction (***P < 0.001). Error bars represent SD. (F) qPCR log2 fold change values of MyD88 after 24-h feeding P. mandapamensis pDS-gfp or P. mandapamensis pDS-MyD88 and subsequent 30 min exposure to MACs. Results were calculated using the DDCT method across four biological replicates (n = 4) with ~500 larvae per replicate per treatment. Error bars represent SD. (G) HCR of MyD88 (turquoise) and DNA (DAPI, gray) in larvae after 24-h feeding P. mandapamensis pDS-gfp and subsequent exposure to MACs for 5 min. Images were taken with an oil objective at 63x. (G1) 2.85× zoom. (H) HCR of MyD88 (turquoise) and DNA (DAPI, gray) in larvae after 24-h feeding P. mandapamensis pDS-MyD88 and subsequent exposure to MACs for 5 min. Images were taken with an oil objective at 63x. (H1) 2.85× zoom.
Fig. 4.
Fig. 4.
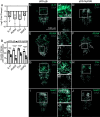
MyD88 activates immune and developmental genes upon the stimulation of metamorphosis by bacteria. (A) Graph of qPCR log2 fold change values of IL17, RUNX, Fos, and NHR2 in larvae fed P. mandapamensis pDS-gfp or pDS-MyD88 for 24 h and then exposed to MACs for 30 min. Results were calculated using the DDCT method across four biological replicates (n = 4) with ~500 larvae per replicate per treatment. Error bars represent SD. (B) Graph of expression counts of NHR2, IL17, RUNX, and Fos using HCR in larvae fed P. mandapamensis pDS-gfp or pDS-MyD88 for 24 h and then exposed to MACs for 30 min. The graph is an average of three biological replicates (n = 3) with 30 larvae per replicate per treatment, data analyzed using the chi-square test with Yates’ correction (****P < 0.0001, ***P < 0.001). Error bars represent SD. (C and D) HCR of IL17 (turquoise) and DNA (DAPI, gray) in larvae after 24-h feeding P. mandapamensis (C) pDS-gfp or (D) pDS-MyD88 and subsequent exposure to MACs for 30 min. Images were taken with an oil objective at 63x. (C1 and D1) 2.85× zoom. (E and F) HCR of RUNX (turquoise) and DNA (DAPI, gray) in larvae after 24-h feeding P. mandapamensis (E) pDS-gfp or (F) pDS-MyD88 and subsequent exposure to MACs for 30 min. Images were taken with an oil objective at 63x. (E1 and F1) 2.85× zoom. (G and H) HCR of Fos (turquoise) and DNA (DAPI, gray) in larvae after 24-h feeding P. mandapamensis (G) pDS-gfp or (H) pDS-MyD88 and subsequent exposure to MACs for 30 min. Images were taken with an oil objective at 63x. (G1 and H1) 2.85× zoom. (I and J) HCR of NHR2 (turquoise) and DNA (DAPI, gray) in larvae after 24-h feeding P. mandapamensis (I) pDS-gfp or (J) pDS-MyD88 and subsequent exposure to MACs for 30 min. Images were taken with an oil objective at 63x. (I1 and J1) 2.85× zoom.
Fig. 5.
Fig. 5.
Hydroides require MyD88 for bacterial pathogen defense. Hydroides larvae were exposed to ASW, P. mandapamensis pDS-gfp, or P. mandapamensis pDS-MyD88 for 24 h. Subsequently, larvae were exposed to P. aeruginosa PA14 and scored for survival over 8 h. The Y-axis represents % survival at each timepoint on the x-axis (0, 2, 4, 6, and 8 h). The graph is an average of three biological replicates (n = 3) with 30 larvae per replicate per treatment. One-way ANOVA was performed against all six treatments at each individual optical density averaged across the 8 h. A Tukey post hoc test was performed to test for differences between each treatment. Letters denote statistically different treatments. Error bars represent SD.
Fig. 6.
Fig. 6.
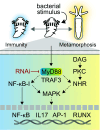
Model of Hydroides immune and developmental regulation during metamorphosis. Our findings support the following model whereby the MyD88 pathway mediates the sensing of a bacterial stimulus in Hydroides larvae and operates at the interface of both the pathogen and metamorphosis response. Upon stimulation by P. luteoviolacea MACs, IL17, RUNX, and NHR2 are positively regulated by MyD88 and their expression localizes to the cilia, nervous system, and/or cerebral ganglia of Hydroides larvae. In a parallel pathway, diacylglycerol (DAG) and Protein Kinase C (PKC) activate NHR1 and NHR2 (53). MyD88 also activates p38 and JNK MAPK signaling (14, 53, 55). When challenged with P. aeruginosa, MyD88 mediates a bacterial pathogen response through a yet unknown pathway.

Comment in

References

    1. Gilbert S. F., Bosch T. C. G., Ledón-Rettig C., Eco-evo-devo: Developmental symbiosis and developmental plasticity as evolutionary agents. Nat. Rev. Genet. 16, 611–622 (2015). - PubMed
    1. Schmidt B. R., Hödl W., Schaub M., From metamorphosis to maturity in complex life cycles: Equal performance of different juvenile life history pathways. Ecology 93, 657–667 (2012). - PubMed
    1. Warkentin K. M., Environmentally cued hatching across taxa: Embryos respond to risk and opportunity. Integr. Comp. Biol. 51, 14–25 (2011). - PubMed
    1. Hill J. H., et al. , BefA, a microbiota-secreted membrane disrupter, disseminates to the pancreas and increases β cell mass. Cell Metab. 34, 1779–1791.e9 (2022). - PMC - PubMed
    1. Mishra A., et al. , Microbial exposure during early human development primes fetal immune cells. Cell 184, 3394–3409.e20 (2021). - PMC - PubMed

MeSH terms

Substances

LinkOut - more resources