. 2025 Jun 2;16(1):4698.
doi: 10.1038/s41467-025-59858-0.

Constraints on sea-level rise during meltwater pulse 1B from the Great Barrier Reef

Affiliations

Constraints on sea-level rise during meltwater pulse 1B from the Great Barrier Reef

Jody M Webster et al. Nat Commun. .

Abstract

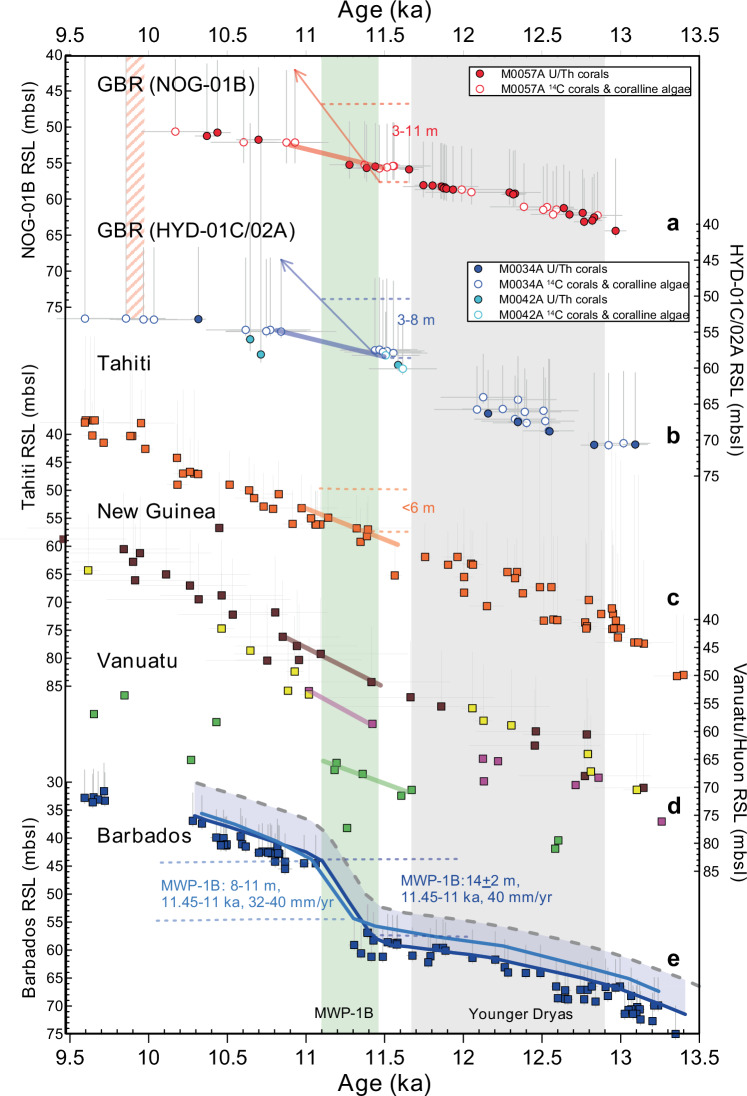
The timing, rate, and magnitude of rapid sea-level rise during Meltwater Pulse 1B (MWP-1B, ~11.45-11.1 ka) remain controversial. Robust constraints on past MWPs are crucial to future predictions of global ice sheet instability. Using 154 new and existing U/Th and calibrated 14C-AMS dates from coral, algae, and microbialites recovered during Integrated Ocean Drilling Program Expedition 325, this study reconstructs reef development and relative sea-level (RSL) rise on the Great Barrier Reef (GBR). We identify 107 in situ RSL index points while refining estimates of vertical accretion and paleowater depth. Results show RSL rise during MWP-1B did not exceed 10.2-7.7 m or rates of 30-23 mm/yr, and was likely less. The GBR did not drown, indicating resilience to MWP-1B. These findings are more consistent with Tahiti and other Pacific records and do not support the Barbados record of MWP-1B as an abrupt step in global sea level, with a magnitude > 11 m.


Conflict of interest statement

Competing interests: The authors declare no competing interests.

Figures

Fig. 1
Fig. 1. Geomorphic, chronostratigraphic, and biological development of Reef 4 in the Great Barrier Reef (GBR).
High-resolution bathymetric images showing surface geomorphology of NOG-01B (a), HYD-01C (b), and HYD-02A (c), the drill-hole locations (red lines represent core penetration depths), and the depth of distinct terraces on the adjacent seabed. Bathymetric data sets originally published in ref. and publicly available at ref.. df Simplified stratigraphic sections showing the distribution of recovered core intervals, coral assemblages (A through F) and their interpreted paleowater depths (< 10 m or > 20 m), and selected U–Th (black) and 14C AMS (blue) ages at M0057A, M0034A, and M0042A. Chronostratigraphic boundaries of the shallow Reef 4 sequence are represented by solid colored lines (orange base and purple top), and short dashes show their corresponding deep-water fore-reef slope deposits after,,.this study (see Supplementary Fig. 1 for more details). g Map of the GBR showing flooded shelf areas corresponding to sea levels between 45 m and 75 m below (green) the present-day GBR bathymetry after, that approximates the period representing the growth of the “proto-GBR” (Reef 4) between ~13–10 ka. Images of representative core sections showing (h) shallow, high-energy (0–6 m) coralgal assemblages (a) (M0057A-06R) characterizing growth during the Younger Dryas, before and after Meltwater Pulse 1B (MWP-1B), and i deep-water (> 20 m) fore-reef slope assemblages (d) (M0034A-01R) following reef drowning ~10 ka (blue line). More detailed geomorphic, chronostratigraphic, and biologic information is given in Supplementary Fig. 1.
Fig. 2
Fig. 2. Great Barrier Reef (GBR) Reef 4 age vs. depth, vertical accretion, and paleowater depth data.
NOG-01B (M0057A) (a) (red symbols) and HYD-01C/02 A (M0034A, M0042A) (b) (blue symbols) age vs. depth data, paleowater depths (gray vertical lines), the vertical reef accretion histories (red and blue linear growth segment modified after) are based on all available in situ U/Th coral and calibrated 14C AMS coral and coralline algal ages (see Supplementary Table 1). c We calculated their average vertical accretion rates (mm/yr) using a visual best fit approach (after) (red stepped plot for NOG-01B and blue for HYD-01C/02 A) and a Monte Carlo analysis showing the simulated median vertical accretion (red dashed line for NOG-01B and blue for HYD-01C) through time that also fully captures the age and depth uncertainties of the age model (see Supplementary Fig. 3 for more details). Average vertical accretion rates (mm/yr) from the Holocene reefs adjacent to the HYD-01C, 02 A, and NOG-01B transects are shown in the green stepped plot. The Younger Dryas (gray), Meltwater Pulse 1B (MWP-1B) (green), and time of Reef 4 drowning (RD) (red hashed) are shown as vertical shaded bars.
Fig. 3
Fig. 3. Synthesis of available fossil coral reef relative sea-level (RSL) records during the Late Deglacial period between 13.5 and 9.5 ka.
RSL records from the Great Barrier Reef (GBR) (NOG-01B) (M0057A) (a) (red symbols) and HYD-01C/02 A (M0034A, M0042A) (b) (blue symbols) (this study), Tahiti (c) (orange symbols), New Guinea (c) (brown and yellow symbols), Vanuatu (d) pink and green symbols), and Barbados (e) (blue symbols) are shown. The timing, magnitude, and rate of the RSL change during Meltwater Pulse 1B (MWP-1B) are shown for the GBR (this study), Tahiti, New Guinea,, Barbados–dark blue, light blue. See the original data sources for more details about sample context, tectonic corrections, age uncertainties, and paleowater estimates applied to the RSL records in these other studies. The Younger Dryas (gray), MWP-1B (green), and time of GBR Reef 4 drowning (RD) (red hashed) are shown as vertical shaded bars.

References

    1. Camoin, G. F. & Webster, J. M. Coral reef response to quaternary sea-level and environmental changes: state of the science. Sedimentology62, 401–428 (2015).
    1. Yokoyama, Y. & Esat, T. M. In Handbook of Sea-Level Research 104-124 (John Wiley & Sons, Ltd, 2015).
    1. Chappell, J. & Polach, H. Post-glacial sea-level rise from a coral record at Huon Peninsula, Papua New Guinea. Nature349, 147–149 (1991).
    1. Fairbanks, R. G. A 17000 year glacio-eustatic sea-level record: influence of glacial melting rates on the Younger Dryas event and deep ocean circulation. Nature342, 637–642 (1989).
    1. Cutler, K. B. et al. Radiocarbon calibration and comparison to 50 kyr BP with paired 14 C and 230Th dating of corals from Vanuatu and Papua New Guinea. Radiocarbon46, 1127–1160 (2004).

LinkOut - more resources